Burlingame Grove Real Estate - February 2014

Successful Sellers
Like much of the Peninsula, it has been a sellers market in the Burlingame neighborhood of Burlingame Grove (sometimes referred to as Burlingame Gate).Here are some highlights for the Burlingame Grove real estate market as of February 2014:
- There have been 3 home sales in the neighborhood this year, 1/4 of the Burlingame city-wide total. Usually, the area accounts for around 1 out of every 10 to 20 sales in Burlingame. By chance, Burlingame Grove is probably the only area in Burlingame where sales have not been slow to start the year.
- Nearly listed home is selling in the neighborhood. There were actually more sales than new listings in 2013, a rare feat.
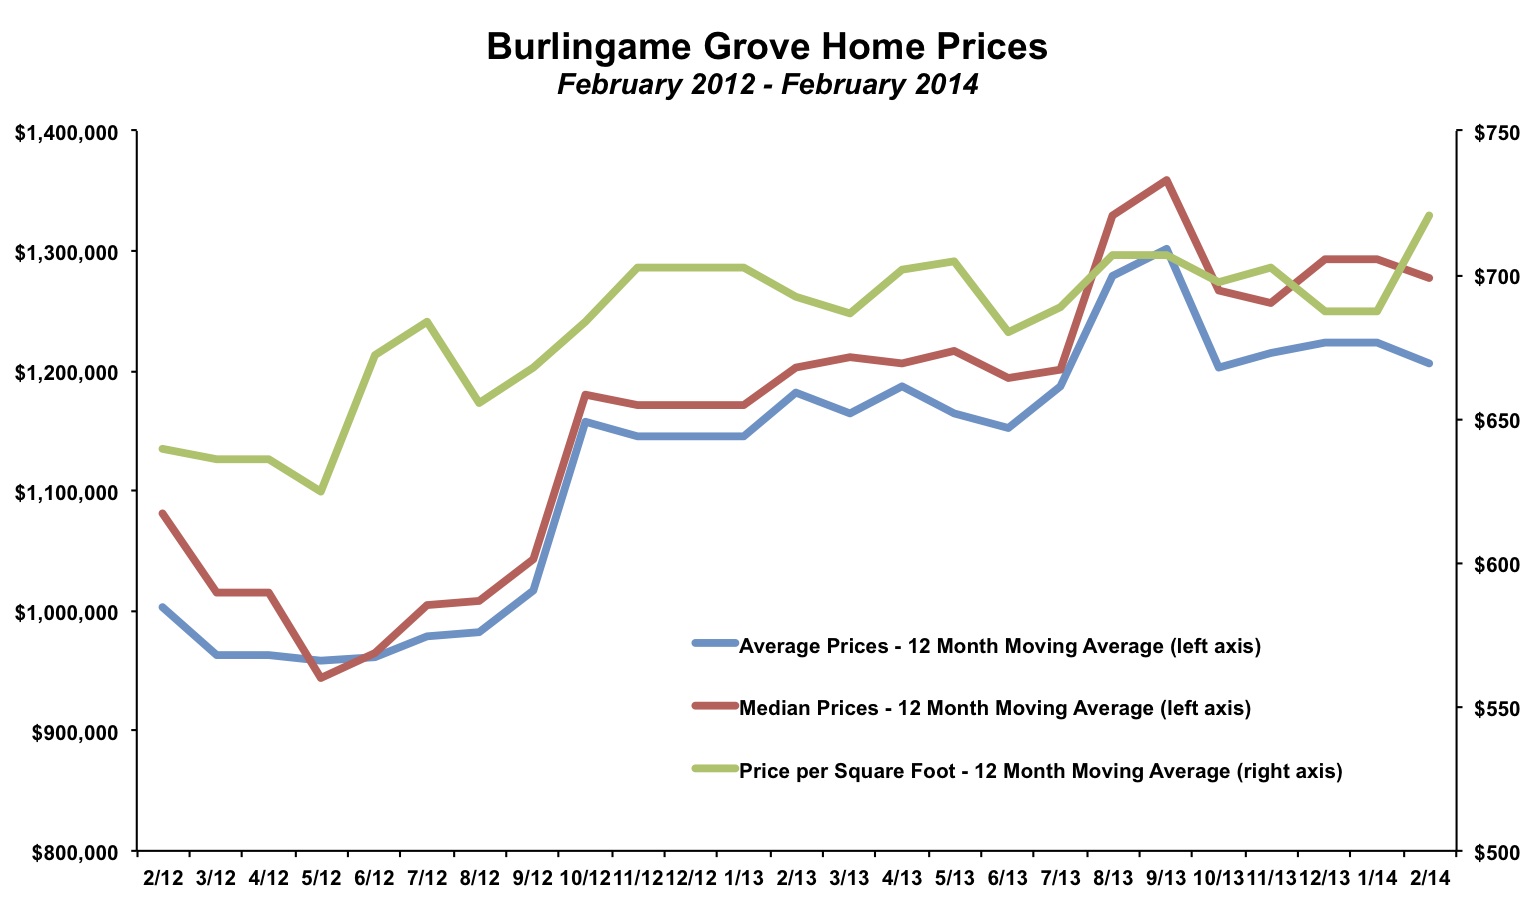
Based on the individual sales in the area, along with what we are seeing across Burlingame, there is no reason to suggest that prices are not at record highs in Burlingame Grove. For example, a 3 bed, 2.5 bath home sold at 1108 Oxford in late 2013 for $1.6 million. The home has previously sold in late 2007 (which was the top of the prior market peak) for $1.5 million. An increase of 7% from previous market highs aligns with what we are seeing across Burlingame.
Also, while the data shows the average days on market nearly doubling in 2013, this is a bit of a red herring. There was a single foreclosed home that stayed on the market for over a year, which impacted the average. Most homes sold in less than three weeks.
By The Numbers - Burlingame Grove Real Estate
| Current Month | YTD Total or Average | |||
| February 2013 | February 2014 | 2012 | 2013 | |
| Sales | 1 | 3 | 10 | 19 |
| Days on Market | 190 | 59 | 22 | 45 |
| Average Price | $1,395,000 | $1,243,000 | $1,053,200 | $1,254,211 |
| Median Price | $1,395,000 | $1,255,000 | $1,077,500 | $1,297,316 |
| Avg $ per Sq Ft | $634 | $937 | $706 | $709 |
Thinking of buying or selling a home in Burlingame Grove?
If you're interested in learning more about the Burlingame Grove real estate market, considering selling your home in Burlingame Grove, or thinking about moving to Burlingame Grove, please drop me a line and I'd love to connect with you.This article is copyrighted by Raziel Ungar and may not be reproduced or copied without express written permission.