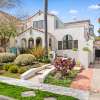
Burlingables Real Estate - October 2013
Very Few Listings
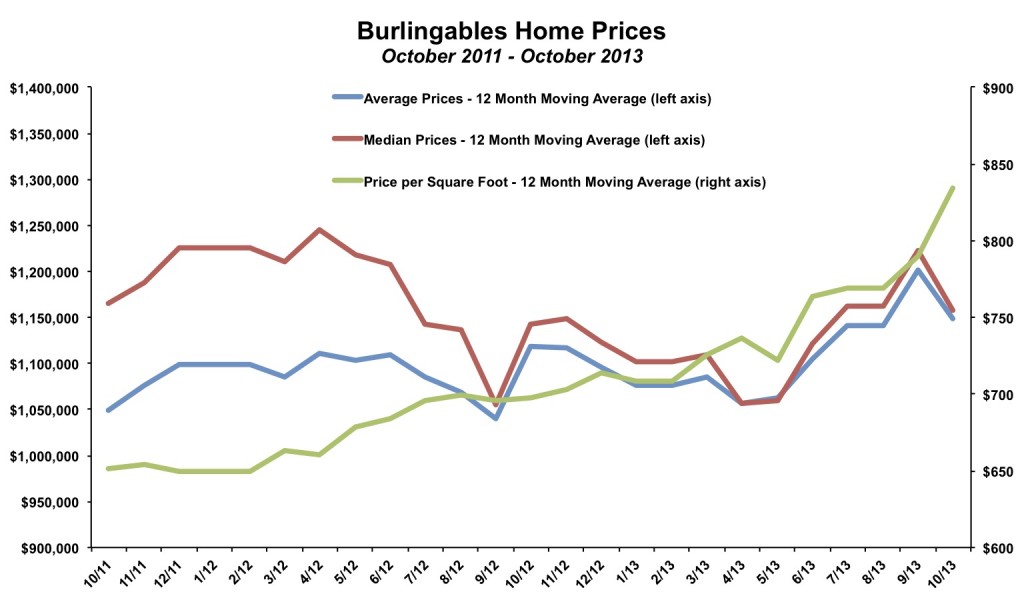
There have been only eight listings (all of which sold) in the first ten months of 2013 in the Burlingables neighborhood of Burlingame. Every home listed since the middle of 2012 has sold, almost all of them for more than the asking price. Here are some highlights for the Burlingables neighborhood as of October 2013:- Every home sold in the past year was on the market for less than a month. The vast majority of homes sold in less than two weeks. The average days on market has been just 11 days in 2013.
- Buyers have on average paid 11% above the asking price in 2013. (That is approximately an extra $125,000 per home).
- Inventory at the end of October 2013 was zero homes.
- Buyers interested in the Burlingables area need to act quickly when a home is listed. Strong initial offers are a must, as virtually every home see multiple offers above the asking price.
By The Numbers - Burlingables Real Estate for 2013
| Current Month | YTD Total or Average | |||
| October 2012 | October 2013 | Jan - Oct 2012 | Jan - Oct 2013 | |
| Sales | 2 | 2 | 13 | 8 |
| Days on Market | 6 | 16 | 9 | 11 |
| Average Price | $1,573,000 | $1,250,000 | $1,148,615 | $1,265,250 |
| Median Price | $1,573,00 | $1,250,000 | $1,175,692 | $1,285,500 |
| Avg $ per Sq Ft | $713 | $977 | $702 | $891 |
Thinking of buying or selling a home in Burlingables?
If you're interested in learning more about the Burlingables real estate market, considering selling your home in Burlingables, or thinking about moving to Burlingables, please drop me a line and I'd love to connect with you.
This article is copyrighted by Raziel Ungar and may not be reproduced or copied without express written permission.

