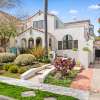
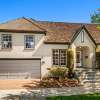
Burlingame Hills Real Estate - February 2013
Rising Prices, But Less Evidence of Bidding Wars
The data points to rising prices in the Burlingame neighborhood of Burlingame Hills. The various measures of price levels, such as average prices, median prices and average price per square foot have all increased. Selling values are up about 10% over the past 12 months as measured by the change in average price per square foot. Median prices and average prices appear to have risen much further, but this is slightly misleading. Burlingame Hills is known for large homes, with the average home in the area over 2,500 square feet, as compared to around 2,000 square feet in the rest of Burlingame. Recent listings and sales have seen some extra large homes that somewhat artificially pushed up the neighborhood's overall average price.Interestingly, the Burlingame Hills real estate market tracks Hillsborough more closely in the way that buyers are not regularly bidding above asking prices. In the rest of Burlingame, multiple offers above the list price are common in the current market environment. In Burlingame Hills (like Hillsborough), the average home is sold for less than the asking price.
Burlingame Hills 2012 Market Summary
Excerpted from the 2012 Burlingame Annual Report -Many of Burlingame’s largest homes are found in the Burlingame Hills. Despite accounting for less than 15% of sales, half of the 20 largest homes sold this year were in Burlingame Hills. The average home sold in the neighborhood was about 2,750 square feet, as compared to nearly 2,100 square feet in all of Burlingame.The average days on market was 65 days in 2012. The average is skewed by a handful of homes that remained on the market for more than 100 days. More than half of homes sold in less than a month.
The average and median prices appear to be up sharply in 2012 compared to 2011, but this is partially due to larger homes selling in 2012 than 2011. The average price per square foot was only up slightly, though it has increased steadily over the past few years. Only two of the 36 homes sold in 2012 went for at least five percent above the asking price. In all of Burlingame, about ¼ of homes sold for at least five percent above asking.
By The Numbers - Burlingame Hills Real Estate for 2013
| Current Month | YTD Total or Average | |||
| February 2012 | February 2013 | Jan - Feb 2012 | Jan - Feb 2013 | |
| Sales | 0 | 1 | 1 | 3 |
| Days on Market | N/A | 54 | 230 | 57 |
| Average Price | N/A | $1,420,000 | $1,100,000 | $1,670,000 |
| Median Price | N/A | $1,420,000 | $1,100,000 | $1,873,333 |
| Avg $ per Sq Ft | N/A | $513 | $440 | $656 |
Thinking of buying or selling a home in Burlingame Hills?
If you're interested in learning more about the Burlingame Hills real estate market, considering selling your home in Burlingame Hills, or thinking about moving to Burlingame Hills, please drop me a line and I'd love to connect with you.
This article is copyrighted by Raziel Ungar and may not be reproduced or copied without express written permission.
=


