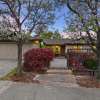
Burlingame Village Real Estate - January 2013
No Inventory
Nearly every home that has been listed in the Burlingame neighborhood of Burlingame Village in the past 18 months has sold in less than a month. The average days on market was 16 days in 2012, down from an already low 38 days in 2011. Burlingame Village typically averages one sale every two months. There are not a lot of sales due to the fact there are not a lot of homes in this small neighborhood (and therefore not a lot of listings). In 2012, ten homes have sold, and only nine homes were newly listed. With sales keeping pace with listings inventory has remained low. In fact, at the end of January 2013, there were no homes on the market in Burlingame Village. Buyers interested in purchasing a home in this neighborhood need to continually be aware of what is coming on the market and be able to make a quick decision about whether to make an offer. Checking if there are any new listings on the weekend and then spending a few days deciding whether to make an offer will mean that you miss out on most homes in this area. It can help to work with a Realtor who know what homes are coming onto the market before they are officially listed.
It is tricky to track price trends in Burlingame Village. It is such a small neighborhood that changes in price levels are more determined by which homes were recently sold, than whether the price of those homes are rising/falling. However, recent sales do indicate that prices are rising, in line with citywide Burlingame trends. The average and median price was above $1 million in 2012 for the first time since 2008.
By The Numbers - Burlingame Village Real Estate for 2012 and January 2013
| Current Month | YTD Total or Average | |||
| January 2012 | January 2013 | Jan - Dec 2011 | Jan - Dec 2012 | |
| Sales | 2 | 1 | 6 | 10 |
| Days on Market | 22 | 45 | 38 | 16 |
| Average Price | $802,000 | $825,000 | $927,500 | $1,005,100 |
| Median Price | $965,000 | $825,000 | $997,833 | $1,086,700 |
| Avg $ per Sq Ft | $588 | $598 | $657 | $602 |
Thinking of buying or selling a home in Burlingame Village?
If you're interested in learning more about the Burlingame Village real estate market, considering selling your home in Burlingame Village, or thinking about moving to Burlingame Village, please drop me a line and I'd love to connect with you.This article is copyrighted by Raziel Ungar and may not be reproduced or copied without express written permission.


