Hillsborough Real Estate - January 2014

2013 Full Year and January 2014
Like the rest of San Mateo County prices are at record levels in the Hillsborough real estate market. Highlights as of January 2014:- Average sale prices exceeded $3.6 million in 2013 and median sales prices exceeded $3.2 million. Both values were more than $450,000 above their previous high.
- The average price per square foot was $815 in 2013, a $100 increase over 2012. This is the first time the average price per square foot has been above $800 on an annual basis.
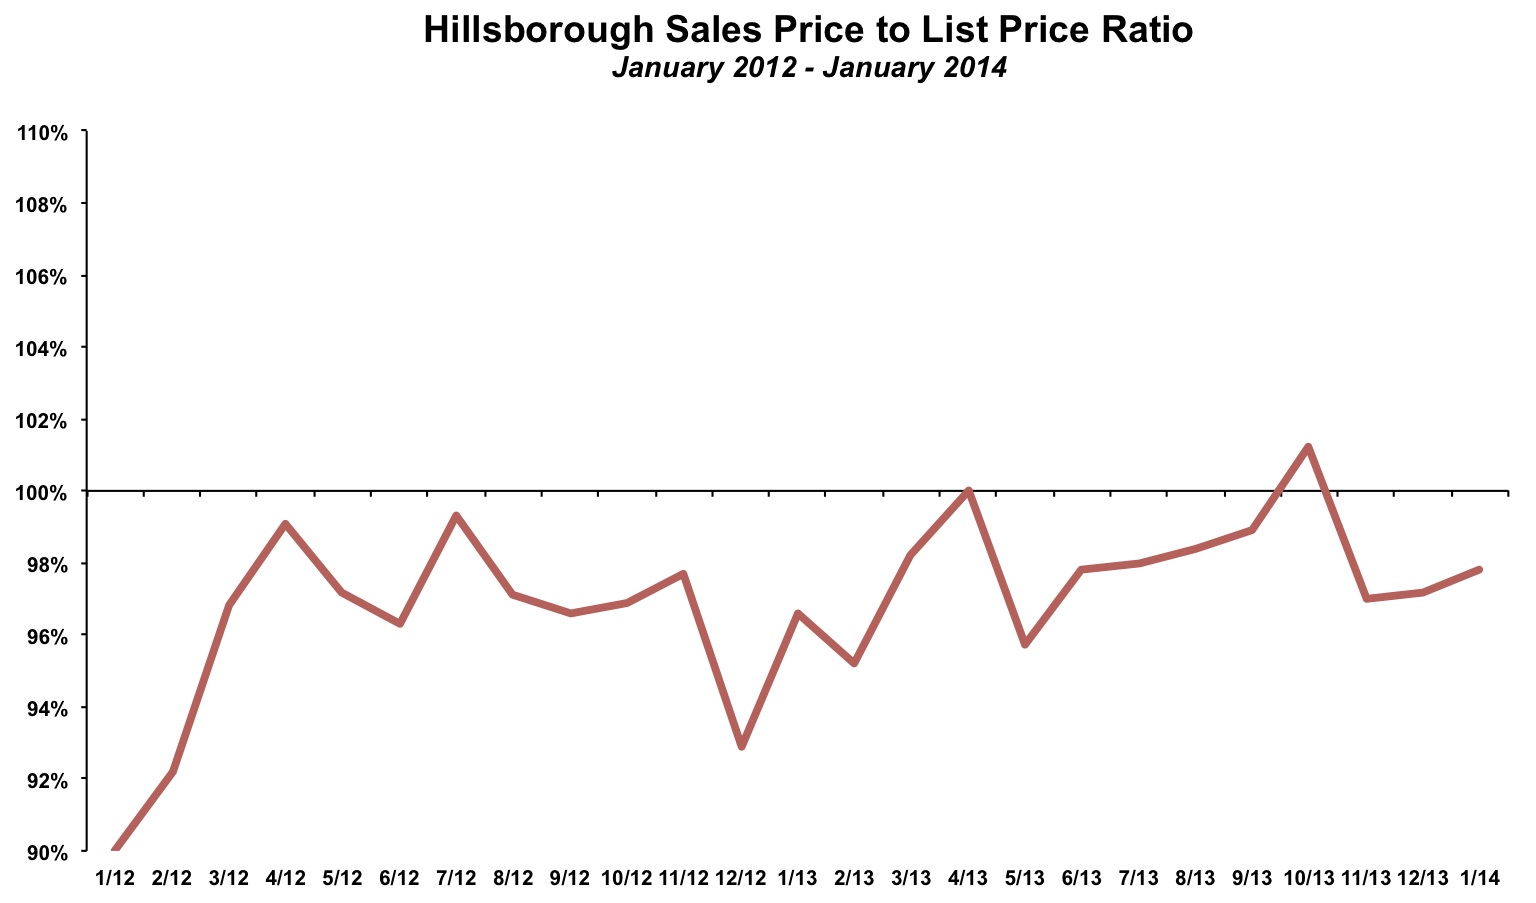
- Homes that do sell are going for 98.2% of their final asking price, the most since 2005.
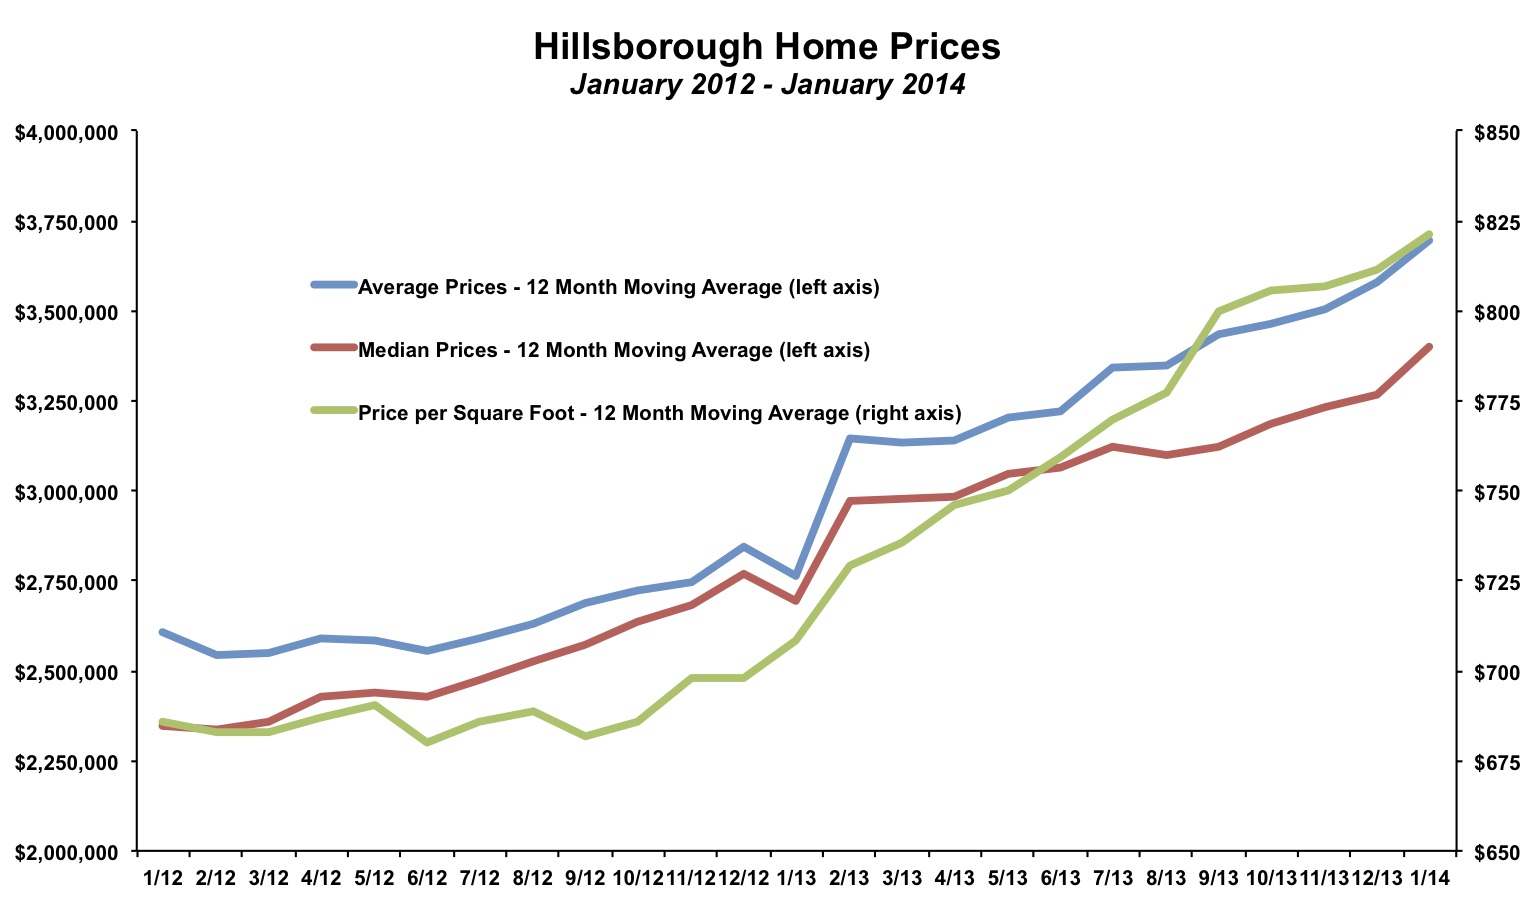
The average price per square foot increased 14% from 2012 to 2013. The average price increased by 26%. The reason for the "discrepancy" is that the average size of homes sold in 2013 was 400 square feet larger than 2012. It is normal to see fluctuations in the size of homes that happen to be listed from one month to the next and from one year to the next. In 2013, the average sold home in Hillsborough has been over 4,400 square feet. In the prior year, the average sold home was 4,000 square feet. There is some evidence to suggest that homes in the area are getting larger. In the past five years, the average sold home has been just over 4,000 square feet. In the five years prior to that, the average sold home was just under 3,800 square feet.
In January 2014, the ratio of sales price to list price was 97.8%. In most areas, a ratio below 100% is a sign that prices are falling as buyers offer less than asking prices (which are based on recent comps). However, the Hillsborough real estate market is somewhat unique. Perhaps due to the fact that the distinctive nature of most of the properties makes setting comps difficult, it is common for sellers to accept bids at or below asking, even in a market favoring sellers.
Few Closed Sales in November, but Lots of Accepted Offers
Home sales typically dip in the winter months in Hillsborough (and across the Peninsula), but the past few months have seen relatively strong sales activity. There were 30 homes sold in December and January. Typically, there are fewer than 20 sales in these two months.There were 145 homes sold in 2013, which is the same as 2012. Sales have been on an upward trend since reaching a bottom of 94 sales in 2008.

The inventory of unsold homes fell to 35 listings in January 2014 in Hillsborough. Inventory levels typically fall in the winter as fewer new listings come onto the market. Still, this is the lowest level of inventory since late 2007/early 2008, though the drop in inventory in Hillsborough has not been anywhere near as dramatic as other areas of the Peninsula. For example, inventory levels peaked in 2010 by averaging 76 homes. By 2013, they had declined to an average of 53 homes. That is a decline of about 30%. In neighboring Burlingame, average inventory levels peaked in 2009 at 61 homes. By 2013, they had decline to an average of 17 homes, a decline of greater than 70%.

By The Numbers - Hillsborough Real Estate
| Current Month | YTD Total or Average | |||
| January 2013 | January 2014 | 2012 | 2013 | |
| Sales | 6 | 12 | 145 | 145 |
| Days on Market | 51 | 88 | 62 | 61 |
| Months of Supply | 7.2 | 2.9 | 4.5 | 4.4 |
| Average Price | $2,070,000 | $3,465,000 | $2,865,483 | $3,607,276 |
| Median Price | $2,200,000 | $3,795,000 | $2,766,048 | $3,240,814 |
| Avg $ per Sq Ft | $752 | $870 | $715 | $815 |
Thinking of buying or selling a home in Hillsborough?
If you're interested in learning more about the Hillsborough real estate market, considering selling your home in Hillsborough, or thinking about moving to Hillsborough, please drop me a line and I'd love to connect with you.
This article is copyrighted by Raziel Ungar and may not be reproduced or copied without express written permission.


