Hillsborough Real Estate - July 2013

Strong Pricing Continues
Similar to other areas of the Peninsula, prices have risen and continue to increase in the Hillsborough real estate market. Highlights as of July 2013:- Average price per square foot was above $800 for the fourth straight month and fifth out of last six months. We haven't consistently seen these prices since the absolute peak in late 2007/early 2008.
- If selling prices in the last five months of the year match what happened in the first seven months, then the 2013 annual median price will be 12% above the previous high, the average price will be 9% above the previous high and the average price per square foot will be 3% above the previous high.
- The average home sold so far in 2013 has measured at 4,140 square feet, which even by Hillsborough standards is big. In the last ten years it has not been above 4,010 square feet.
- While inventory levels have fallen since 2010, the 62 for-sale homes left on the market in Hillsoborough at the end of July 2013 is actually about even with the ten year historical average. Most areas of the Peninsula have below-average inventory, some are quite below.

The shift in pricing is really apparent when looking at the raw average price per square foot data. These are the actual monthly totals with no smoothing. From mid 2011 to late 2012 the line hovers around $700 per square foot. There is some sign of increase as it is more often above $700 as time progresses. But look what happens in 2013. The baseline jumps to $800 per square foot and depending on what happens in the next few months one could make a case that the baseline is closer to $850 per square foot.

Hillsborough Inventory Levels Out of Sync with Neighboring Areas
Across San Mateo County, inventory levels in the real estate market are at historic lows. At the end of July 2013, there were around 625 unsold single family homes on the market. In the last ten years July inventory has never been below 800, and is regularly well above 1,000.In Hillsborough, there were 62 unsold homes on the market at the end of July 2013. In the last ten years, July inventory has ranged between 47 and 90. Last July, inventory stood at 61 homes.
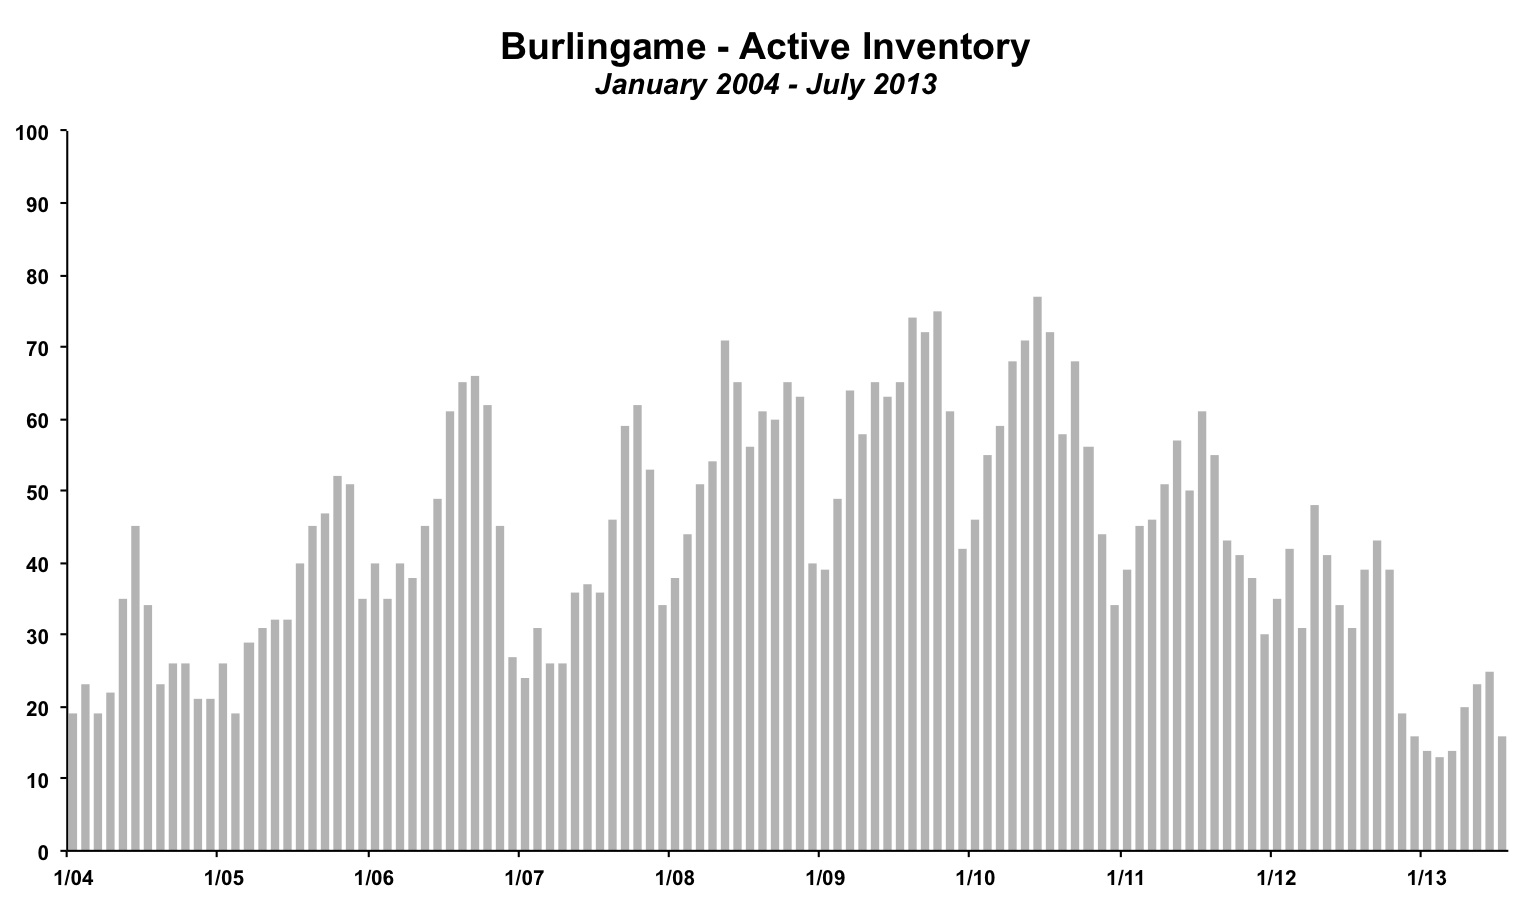
Below are graphs of inventory for the Hillsborough and neighboring Burlingame markets. They are set to the same scale on both axes to allow for easier comparison. Over the last ten years, inventory in Burlingame has averaged just over 40 homes, while inventory is Hillsborough has averaged approximately 55 homes. Both reached peak inventory levels in June 2010. Hillsborough had 95 unsold homes. Burlingame had 77 unsold homes.
One would expect Burlingame to have lower inventory today than Hillsborough given their recent past history. However, the difference is striking. In Burlingame, inventory fell from 77 to just 16 homes as of July 2013. Since the end of 2012 it has been hitting record monthly lows. In Hillsborough, inventory did fall, but as one can see, it is not at record lows and in fact is a little above the average seen in the past ten years.
There are a few take-aways: (1) Buyers looking at the higher end of Burlingame should consider broadening their scope to include Hillsborough if they have not already. (2) Hillsborough may be at a greater risk of soft pricing in the near future given its higher relative inventory.

Sales Down Slightly From Last Year's Pace
Through the first seven months of 2013, there have been 78 homes sold, down from 86 transactions in the first seven months of 2012. At the current rate, there will be around 130 homes sold in Hillsborough, even with the ten year average, which has fluctuated from a low of 94 sales in 2008 to 168 sales in 2004.
By The Numbers - Hillsborough Real Estate for 2013
| Current Month | YTD Total or Average | |||
| July 2012 | July 2013 | Jan - Jul 2012 | Jan - Jul 2013 | |
| Sales | 23 | 15 | 86 | 78 |
| Days on Market | 51 | 81 | 57 | 59 |
| Months of Supply | 2.7 | 4.1 | 4.6 | 5.2 |
| Average Price | $2,894,000 | $4,331,000 | $2,740,558 | $3,411,769 |
| Median Price | $2,660,000 | $3,315,000 | $2,571,826 | $3,047,962 |
| Avg $ per Sq Ft | $750 | $873 | $713 | $816 |
Thinking of buying or selling a home in Hillsborough?
If you're interested in learning more about the Hillsborough real estate market, considering selling your home in Hillsborough, or thinking about moving to Hillsborough, please drop me a line and I'd love to connect with you.
This article is copyrighted by Raziel Ungar and may not be reproduced or copied without express written permission.