Belmont Real Estate - February 2014

Prices Continue to Rise in Belmont
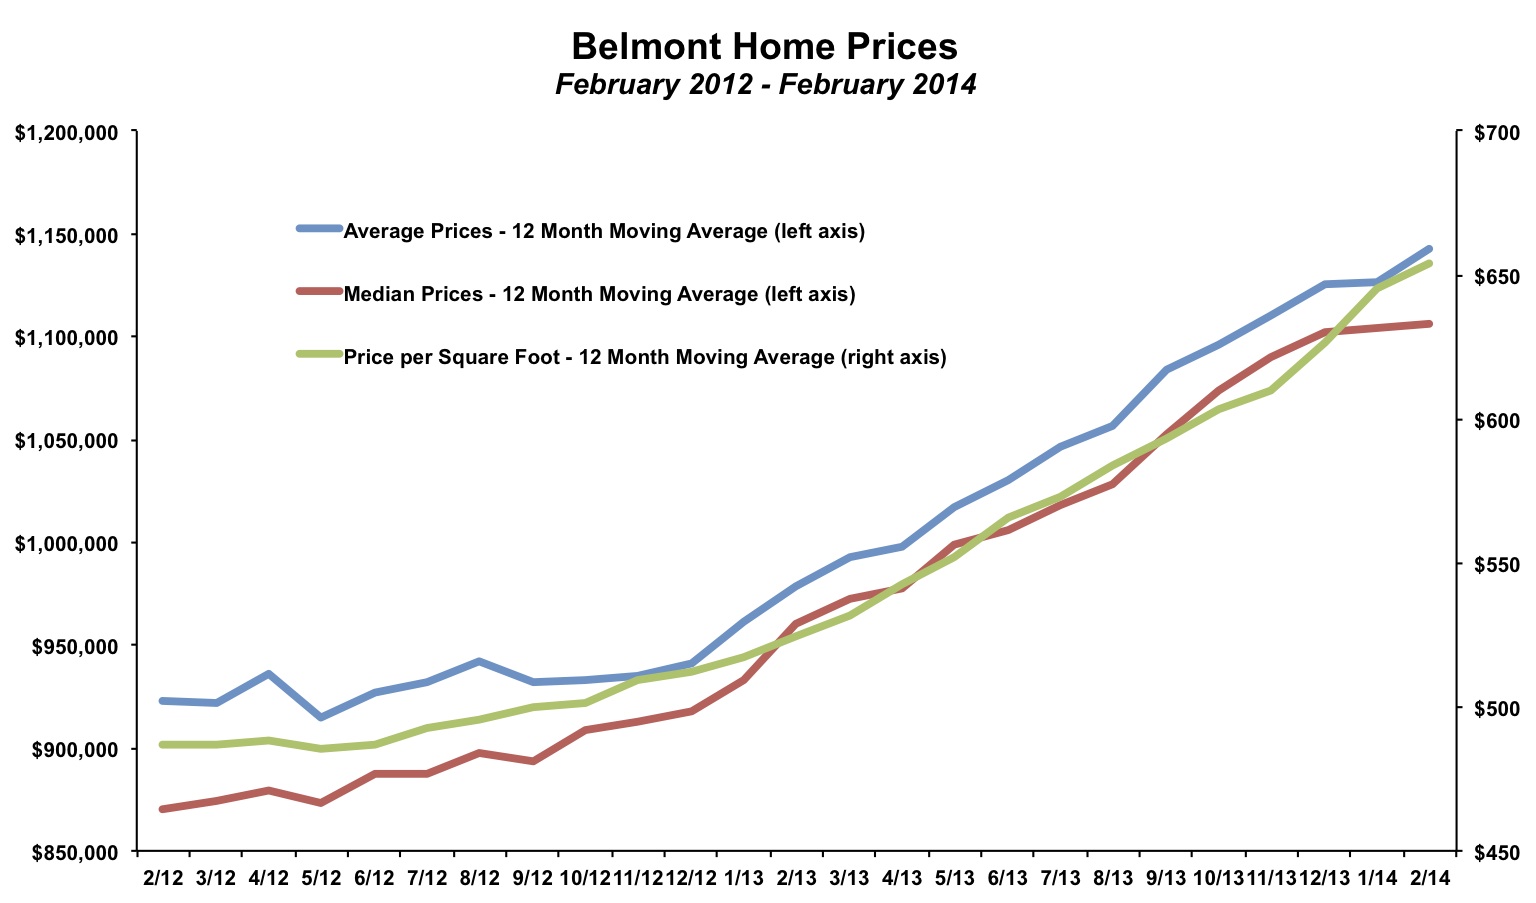
While prices rose in all areas across the Peninsula in 2013, some of the highest increases based on the data were seen in the Belmont real estate market. The early data from 2014 suggests that prices continue to rise and that bidding wars remain commonplace. Here are some highlights for the Belmont real estate market as of February 2014:- The average price per square foot in the past three months have been the highest ever monthly recorded values in Belmont, December 2013 ($696), January 2014 ($749), February 2014 ($687).
- Sellers have been incredibly successful. In the past 12 months, only 20 listings have expired or were cancelled, which is a proxy for listings that did not end up selling. In 2012, there were 56 expired/cancelled listings and as recently as 2010 there were over 100 such listings.
- Inventory remains low with just 11 unsold homes as of February 2014 as compared to 17 unsold homes at the end of February 2013 and 30 unsold homes at the end of February 2012.
The data suggests that Belmont is seeing more bidding wars than many others of San Mateo County. Across the county, the average single family home sold for 5% above the final asking price in 2013, which is representative of a market favoring sellers. In Belmont, the average home sold for an incredible 9% above the asking price in 2013! The majority of homes are selling for more than the asking price. Even though sellers have raised asking prices based on recent comps the bidding wars continued into 2014. The ratio of sales prices to list prices in 2014 has been 108%.
Home sales increased slightly in 2013 to 263 sales, up from 244 sales in 2012. Impressively, this occurred at the same time that new listings fell from 282 listings to 273 listings. The ratio of sales to listings was 96% in Belmont. This is one of the highest ratios we have seen in any area of the Peninsula that we track. Nearly every home is selling.
Not surprisingly given that sales rose at the same time as listings declined, inventory levels fell in 2013. The year ended with just 4 unsold homes on the market in Belmont. The previous low in the prior five years was 8 unsold homes. Inventory levels have ticked up slightly in line with normal seasonal patterns to 11 unsold homes as of the end of February 2014. Still, inventory levels remain incredibly constrained. Five years ago, there were 47 unsold homes on the market at the end of February.
Low inventory will likely continue to put upward pressure on prices. Buyers should expect to compete against multiple offers for most listings.
By The Numbers - Belmont Real Estate
| Current Month | YTD Total or Average | |||
| February 2013 | February 2014 | 2012 | 2013 | |
| Sales | 11 | 13 | 244 | 263 |
| Days on Market | 17 | 11 | 31 | 21 |
| Months of Supply | 1.5 | 0.8 | 1.4 | 0.7 |
| Average Price | $1,026,000 | $1,222,000 | $951,627 | $1,134,110 |
| Median Price | $1,108,000 | $1,125,000 | $926,582 | $1,107,840 |
| Avg $ per Sq Ft | $583 | $687 | $516 | $632 |
Thinking of buying or selling a home in Belmont?
If you're interested in learning more about the Belmont real estate market, considering selling your home in Belmont, or thinking about moving to Belmont, please drop me a line and I'd love to connect with you.
This article is copyrighted by Raziel Ungar and may not be reproduced or copied without express written permission.