Burlingame Real Estate - November 2013
November 2013 - Another Record Setting Month
It was another record setting month in the Burlingame real estate market as prices continue to rise to new highs and most homes selling very quickly. Here are the highlights for November 2013 (comparisons are made to data going back to January 2004):- The average price per square foot was above $800 for the first time in Burlingame. It was $853 in November! The high level was driven in part by a single sale on Chapin Avenue (see recent sales near end of the post), but even without the sale it would still have been above $800 for the first time ever.
- The 21 homes sold in November were on the market for an average of just 11 days. These are the quickest pace of sales ever in Burlingame.
- The sales price to list price ratio was 107.8%. It has been at or above 100% in 21 of the last 22 months.
- Inventory stood at just 11 unsold homes at the end of the month, which was the lowest in at least ten years.
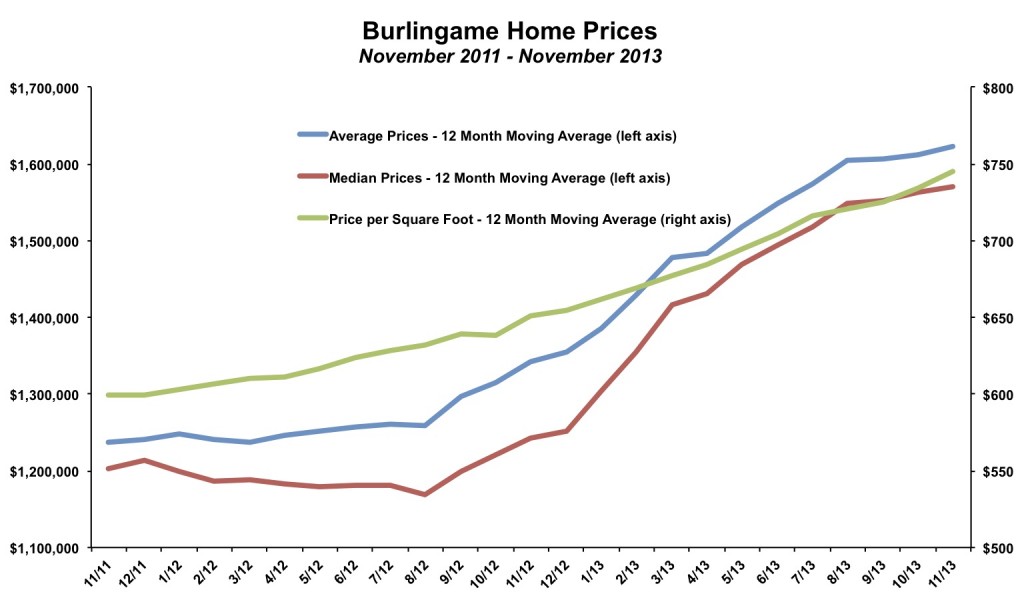
On a year-over-year basis, prices have increased by 15% to 20%. Since reaching bottom in the middle of 2011, prices have risen by 25% to 30%.
The average home sold for 107.8% in November 2013. While, on average, homes continue to sell for more than their asking, though there is wide variation. In the most recent month, about 1/3 of homes sold for more than 10% above the list price, 1/3 sold for less than the final list price and 1/3 sold for a small amount above asking.
The fact that the average sales price to list price ratio has remained well above 100% is a signal that prices are likely to continue to rise.
Sales Activity Strong in November
There were 21 homes sold in Burlingame in November 2013, above the 17 homes sold in November 2012. With just one month left to go in 2013, there have been 236 sales, as compared to 245 sales at the same point in 2012. Already, 2013 has had more sales than any year between 2007 and 2011.Sales would be even higher if there were more new listings. The ratio of sales to new listings in 2013 has been 88% through November. If December is anything like the previous ten Decembers, there will be more sales than new listings. The ratio is likely to reach 90% for the year. The previous high was 89% in 2004. The ratio reached a low of 55% in 2008, when many sellers had difficult drumming up decent offers.
The vast majority of listings are selling and doing so quickly. If there had been more listings, there would likely have been more sales. More simply said, there has been more demand than supply in 2013.
There have been only 268 new listings through November, down 12% from the 303 homes listed in the first eleven months of 2012. It is likely that there will be fewer than 300 new listings in 2013 for the first time in at least a decade.
Relatively few listings combined with modestly high sales activity has resulted in record low inventory levels. At the end of November 2013, there were just 11 homes on the market, as compared to 19 homes for sale at the end of November 2012, and 38 unsold home in November 2011. Going back to the beginning of 2004, current inventory is the lowest both in the absolute number of unsold homes at the end of the month, but also in the ratio of inventory to sales. At the current sales rate, inventory would be depleted in 2 weeks, unless there are new listings. The "normal" ratio of inventory to sales over the past ten years has been around 10 weeks.
Recent Home Sales in Burlingame
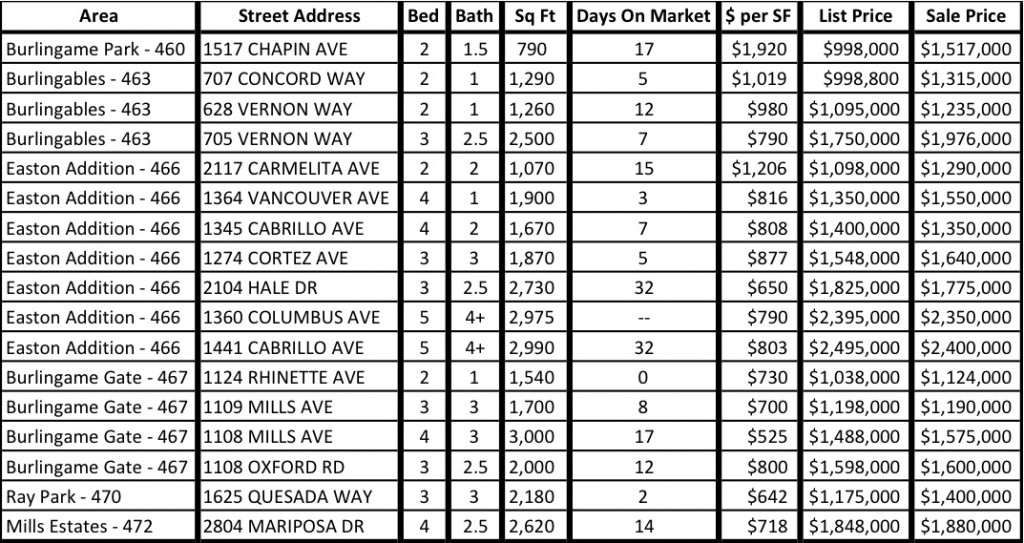
Below is a selection of recent Burlingame real estate sales, sorted by area of Burlingame. These 17 sales provide a good cross section of the local real estate market. Almost all homes continue to sell quickly. Only two of the homes were on the market for more than three weeks.It is a very difficult market for determining values. About 2/3 of the homes went for at least $80,000 different than the asking price (only one of which went for more than $80,000 below). For buyers, it is tough to know whether a listing is going to go $200,000 over asking or $50,000 under asking. There is a very real possibility of overpaying by $250,000 or on the other hand just missing out on a dream home. A local, knowledgeable Realtor can help with valuations.
Every sold home crossed the $1 million threshold! Usually there are a few older and/or smaller homes that sell for sub $1 million. The 2 bed, 1.5, 790 square foot home on 1517 Chapin would normally have been one of those homes. However, its desirable location in Burlingame Park, near downtown Burlingame, and on the west side of El Camino, along with a woodsy, 7,800 square foot lot meant that the property went way, way over asking. It sold for $1,517,000, which works out to $1,920 per square foot. Likely, the buyers have an eye on tearing down or adding on to the existing bungalow-size house. The per square footage price may be a record for Burlingame.
While the price paid was clearly an outlier, there were two other listings that went for more than $1,000 per square foot. On the flip side, only one home sold for less than $600 per square foot (actually, there was only one less than $642 per square foot). For comparison, the average price per square foot in all of 2012 was $657, while in 2011 it was $599.
To see all of the latest Burlingame neighborhood specific market updates, click here.
By The Numbers - Burlingame Real Estate for 2013
| Current Month | YTD Total or Average | |||
| November 2012 | November 2013 | Jan - Nov 2012 | Jan - Nov 2013 | |
| Sales | 17 | 21 | 245 | 236 |
| Days on Market | 45 | 11 | 32 | 24 |
| Months of Supply | 1.1 | 0.5 | 1.7 | 0.9 |
| Average Price | $1,541,000 | $1,659,000 | $1,369,445 | $1,649,657 |
| Median Price | $1,450,000 | $1,535,000 | $1,277,535 | $1,591,695 |
| Avg $ per Sq Ft | $724 | $853 | $660 | $762 |
Thinking of buying or selling a home in Burlingame?
If you're interested in learning more about the Burlingame real estate market, considering selling your home in Burlingame, or thinking about moving to Burlingame, please drop me a line and I'd love to connect with you.
This article is copyrighted by Raziel Ungar and may not be reproduced or copied without express written permission.

