San Mateo Park Real Estate - February 2014
Home Prices Rising in San Mateo Park
The San Mateo Park real estate market has experienced many of the same trends as the rest of the mid-Peninsula. Prices have risen, buyers are often bidding above asking prices, and inventory levels have dwindled.Here are some highlights of the San Mateo Park real estate market through the end February 2014:
- Six homes have sold in the first two months of the year, which is fairly typical for the area during the slower winter months.
- It is hard to draw conclusions with just six home sales, but we do note that the average price per square feet has been above $785. The record annual high was $753 in 2006. It was $741 in 2013.
- Inventory stood at just two homes as of the end of February 2014, and has been at or below 2 unsold homes each of the past three months. In a "normal" market, inventory is usually around 5 to 9 unsold homes in San Mateo Park.
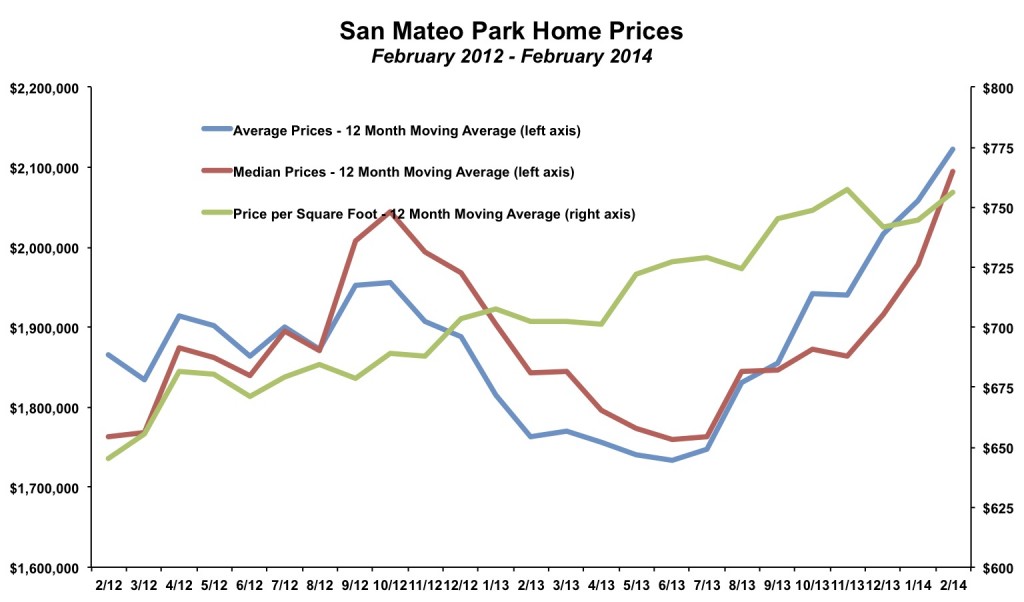
Similarly, the trend for home prices at first glance appears a little confusing. The graph below shows the 12 month moving average for median prices, average prices and average price per square foot in San Mateo Park. The data shows median prices and average prices peaking in late 2012, falling until mid-2013, and then rising rapidly again. While the calculations are correct (we double checked), the conclusion is not. A lot of the movement was due to the type of homes that were being listed and selling, not actual changes in prices. What happened is that the type of homes that were coming onto the market in early and mid 2012 were around 2,800 square feet. This is typical for the San Mateo Park market. At that time, underlying prices had just started to rise in the area and most of the Peninsula. At the end of 2012 and into mid-2013, the type of homes that sold were on average under 2,300 square feet. These are normal random fluctuations, but had the effect of masking the rise in prices. Then in late 2013 and into early 2014, the average sold home was over 3,000 square feet. This whipsaw change in the size of homes being listed and sold gave the up-and-down impact to prices.
The partial adjustment for the change in the home sizes is to measure price per square foot. Seen in the green line below, this shows a steady and sustained increase in prices. This is a better indicator of what happened in the market. Buyers have continually paid more for a given amount of house. (One side note, it is generally true that larger homes sell for less per square foot. The larger homes selling in late 2013 and early 2014 have probably pushed down the price per square foot slightly).
By The Numbers - San Mateo Park Real Estate
| Current Month | YTD Total or Average | |||
| February 2013 | February 2014 | 2012 | 2013 | |
| Sales | 3 | 2 | 33 | 42 |
| Days on Market | 103 | 28 | 21 | 36 |
| Average Price | $1,622,000 | $2,395,000 | $1,889,848 | $1,987,190 |
| Median Price | $1,525,000 | $2,925,000 | $1,967,485 | $1,863,095 |
| Avg $ per Sq Ft | $629 | $766 | $689 | $741 |
Thinking of buying or selling a home in San Mateo Park?
If you're interested in learning more about the San Mateo Park real estate market, considering selling your home in San Mateo Park, or thinking about moving to San Mateo Park, please drop me a line and I'd love to connect with you.
This article is copyrighted by Raziel Ungar and may not be reproduced or copied without express written permission.

