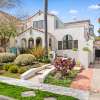
Burlingame Park Real Estate - October 2013
Prices Up 15%+ in Past Year in Burlingame Park
Prices have risen by more than 15% in the past 12 months in the Burlingame Park real estate market. Buyers are regularly paying above $700 per square foot. Here are some highlights in this submarket as of July 2013:- There was one sale, a 5 bed 2 bath 3,140 square foot home on Ralston. It sold for $2,368,995 after 18 days on the market. This was actually below the final listing price of $2,395,000. However, at $754 per square foot, the sale was representative of the new price levels in the area, where above $700 is the norm.
- Sellers continue to be incredibly successful. Only one listing has expired or been cancelled so far this year. Just a few years ago there was an average of one listing expiring/canceling per month.
- Inventory remains low. At the end of July 2013, there was only one active listing on the market.
While most of the submarkets in Burlingame are regularly seeing sales that are well above final list prices, Burlingame Park is acting more like neighboring Hillsborough, where sales prices and list prices are more evenly matched. This is not too surprising as Burlingame Park shares more of a border with Hillsborough than the rest of Burlingame. The average sales price to list price in Burlingame Park in 2013 has been 101% (helped by one listing that went 111% above the list price), versus 105% in all of Burlingame.
Prices have risen by around 20% in the past twelve months in Burlingame Park. The average price per square foot in 2013 has been $775, which is 20% above the 2012 level of $644 per square foot. The overall median and average price are up 40% to 60% year-over-year. This is misleading and is due mostly to the fact that larger homes happen to have been what have been listed in 2013. The average sold home in 2013 in Burlingame Park has been just over 3,000 square feet. In most years it is around 2,500 square feet. Larger homes have higher price tags. This is all part of normal random fluctuations that appear when looking at a single submarket, but something that prospective buyers may not be aware of if they are only looking at the headline data.
By The Numbers - Burlingame Park Real Estate for 2013
| Current Month | YTD Total or Average | |||
| October 2012 | October 2013 | Jan - Oct 2012 | Jan - Oct 2013 | |
| Sales | 2 | 1 | 17 | 21 |
| Days on Market | 25 | 10 | 42 | 32 |
| Average Price | $1,253,000 | $2,850,000 | $1,438,118 | $2,321,095 |
| Median Price | $1,253,000 | $2,850,000 | $1,721,765 | $2,408,952 |
| Avg $ per Sq Ft | $557 | $1,062 | $659 | $775 |
Thinking of buying or selling a home in Burlingame Park?
If you're interested in learning more about the Burlingame Park real estate market, considering selling your home in Burlingame Park, or thinking about moving to Burlingame Park, please drop me a line and I'd love to connect with you.
This article is copyrighted by Raziel Ungar and may not be reproduced or copied without express written permission.


