San Carlos Real Estate - January 2014
Still Favoring Sellers in San Carlos
Buyers continued to big against each other in the San Carlos real estate market. Prices continue to rise and buyers continue to regularly (but not always) pay above asking prices. Here are the highlights as of January 2014:- In January 2014, the monthly readings for average price ($1,562,000), median price ($1,450,000) and average price per square foot ($859) were all the highest recorded in San Carlos.
- Looking broader than just the most recent month confirms that prices are at record levels in San Carlos
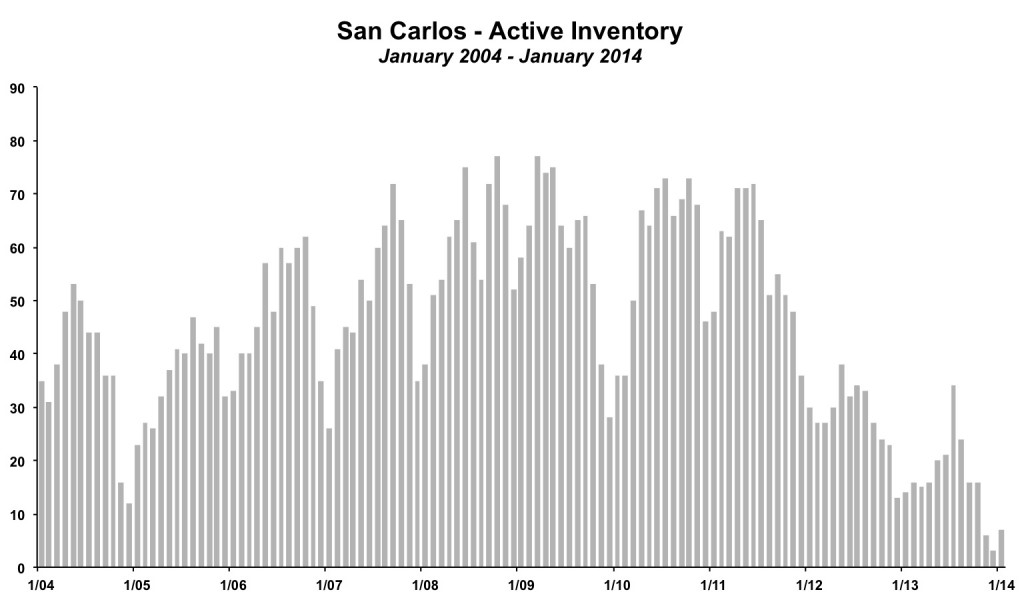
- Inventory levels stood at just 7 homes in January 2014. The last three months have been below 10 homes for the first time in at least ten years. Inventory is severely constrained.
- Buyers continue to outbid each other. The average sold home went for over 5% above the list price, the 12th straight month where the ratio of sales price to list price has been well over 100%.
The chart below shows the 12 month moving average median price price, average price and average price per square foot in San Carlos. The moving average helps to smooth out random month-to-month fluctuations to give a clearer view of trends. All signs point to sustained price increases over the past 20+ months.
Despite sellers adjusting their list prices based on recent comps that capture the rising prices, buyers continue to bid above asking prices. In 2013, the average home sold for an incredible 8.6% above the final asking price (even in what was considered to one of the "hottest" markets ever, the ratio was lower at 6.6% in 2005). In January 2014, the average ratio of sales price to list price was 105%. A reading well above 100% is a sign that buyers outnumber sellers and are having to outbid one another to win the home. It also portends continued price increases.
Sales Activity Strong in January
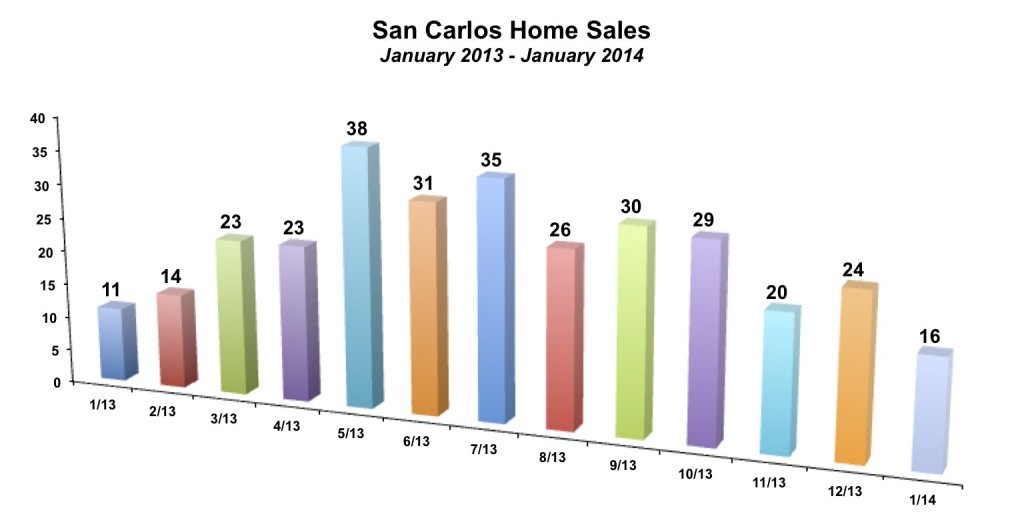
There were 16 homes sold in San Carlos in January 2014, the most to start the year since 2007. January is typically the slowest month in San Carlos and the winter time sees the fewest home sales across the Peninsula.In 2013, there were 304 homes sold. This was down from the 317 homes sold in 2012, but slightly above the average annual number of sales over the past ten years. There were fewer than 300 sales each year from 2007 to 2011.
Sales would be a lot higher if there were more new listings and more inventory to be sold. The number of expired or cancelled listings has plummeted in the area. In 2013, there were just 32 listings that expired or were cancelled by the sellers, versus just over 300 listings sold. Not every expired or cancelled listing represents a failure to sell. In many of these instances, sellers may have decided the timing was not or reevaluated their decision about selling altogether. Regardless, sellers are incredibly successful, with almost every listing selling. There has not been enough new listings to replace the sold homes and inventory has fallen to almost absurd levels. At the end of 2013, there were just 3 unsold homes. At the end of January 2014, there were 7 unsold homes. As recently as 2011, there were 48 unsold homes at the end of January. This lack of inventory is likely to put upward pressure on prices as buyers have to compete against each other for a limited supply of homes.
By The Numbers - San Carlos Real Estate
| Current Month | YTD Total or Average | |||
| January 2013 | January 2014 | 2012 | 2013 | |
| Sales | 11 | 16 | 317 | 304 |
| Days on Market | 51 | 28 | 31 | 16 |
| Months of Supply | 1.3 | 0.4 | 1.1 | 0.7 |
| Average Price | $1,222,000 | $1,562,000 | $1,073,533 | $1,260,151 |
| Median Price | $975,000 | $1,030,000 | $1,007,101 | $1,224,836 |
| Avg $ per Sq Ft | $534 | $859 | $586 | $690 |
Thinking of buying or selling a home in San Carlos?
If you're interested in learning more about the San Carlos real estate market, considering selling your home in San Carlos, or thinking about moving to San Carlos, please drop me a line and I'd love to connect with you.
This article is copyrighted by Raziel Ungar and may not be reproduced or copied without express written permission.


