Burlingame Real Estate - March 2014

March 2014 - Prices Continue to Rise
Prices continue to rise in the Burlingame real estate market. Although it has long been a million dollar market where the average and median sales prices is above $1 million, it is rapidly becoming a million dollar only market. Sub $1 million sales of single family homes are becoming very rare in the city. With most sales at $800 per square foot and above, even 2 bed, 1 bath 1,200 square foot homes are going for above $1 million (especially if the property has a potential for additions). I just sold a two bedroom at 725 Plymouth Way in Burlingables for $1,410,000, and another two bedroom at 221 Stanley in Lyon Hoag for $1,303,000.Here are the highlights for March 2014 (comparisons are made to data going back to January 2004):
- The average price per square foot was $880, the second highest ever behind February 2014
- Four homes sold above $1,000 per square foot versus ten such homes in all of 2013
- Most homes sold quickly. The average sold home was on the market for just 14 days.
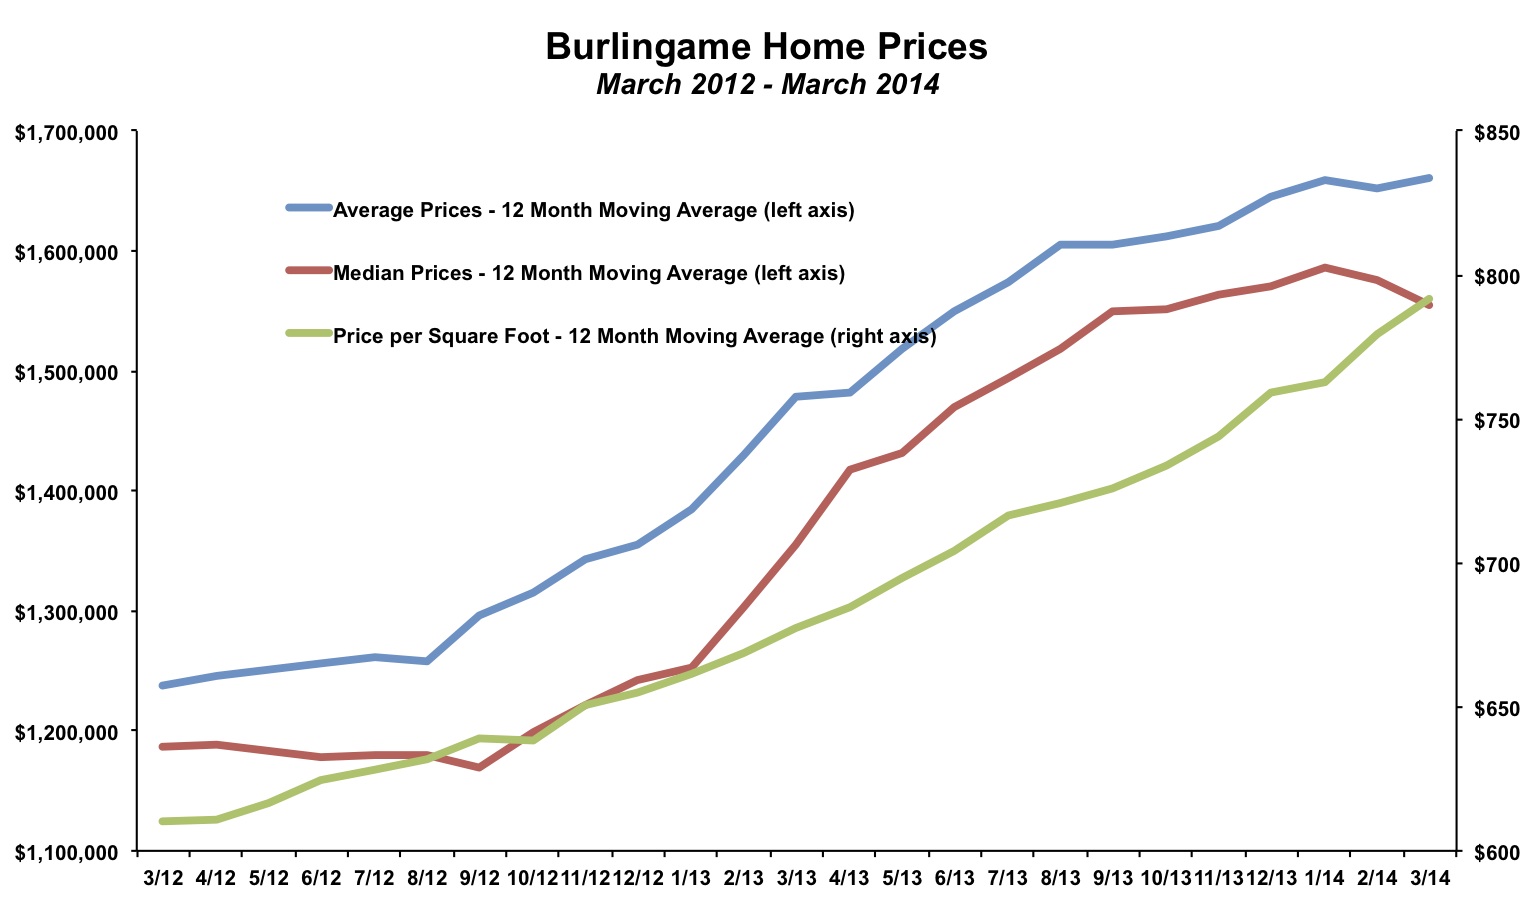
In nominal terms, prices reached a new record level in the middle of 2013, surpassing the previous high in late 2007/early 2008. However, due to general underlying inflation, the value of a dollar has eroded during that time. Once you adjusted for inflation, "real" prices were still not at their previous. The continued increases in prices since the middle of 2013 now means that after adjusting for inflation, prices have now matched, if not surpassed their previous high in late 2007/early 2008.
The ratio of sales price to list price is one indicator of market demand. In most areas, when the ratio is greater than 100% it is a sign that there are bidding wars and prices are rising. When the ratio is below 100%, sellers are having to cut prices to make the sale. The ratio went below 100% in January, which served as a warning flag that buyer demand may have been flagging. It increased in February and then again in March when the ratio was 105.1%. Despite sellers increasing their list prices based on recent price increases, buyers continue to bid above asking.

Sales Pick Up in March, but Remain Low
Matching the normal seasonal pattern, sales increased in March with 18 homes sold up from just 7 sales in February. Still, sales remain low. There have been just 30 homes sold to start the year, as compared to 44 homes in the first three months of 2013. It is the fewest sales since 2009, when just 23 homes were sold in the first quarter of the year.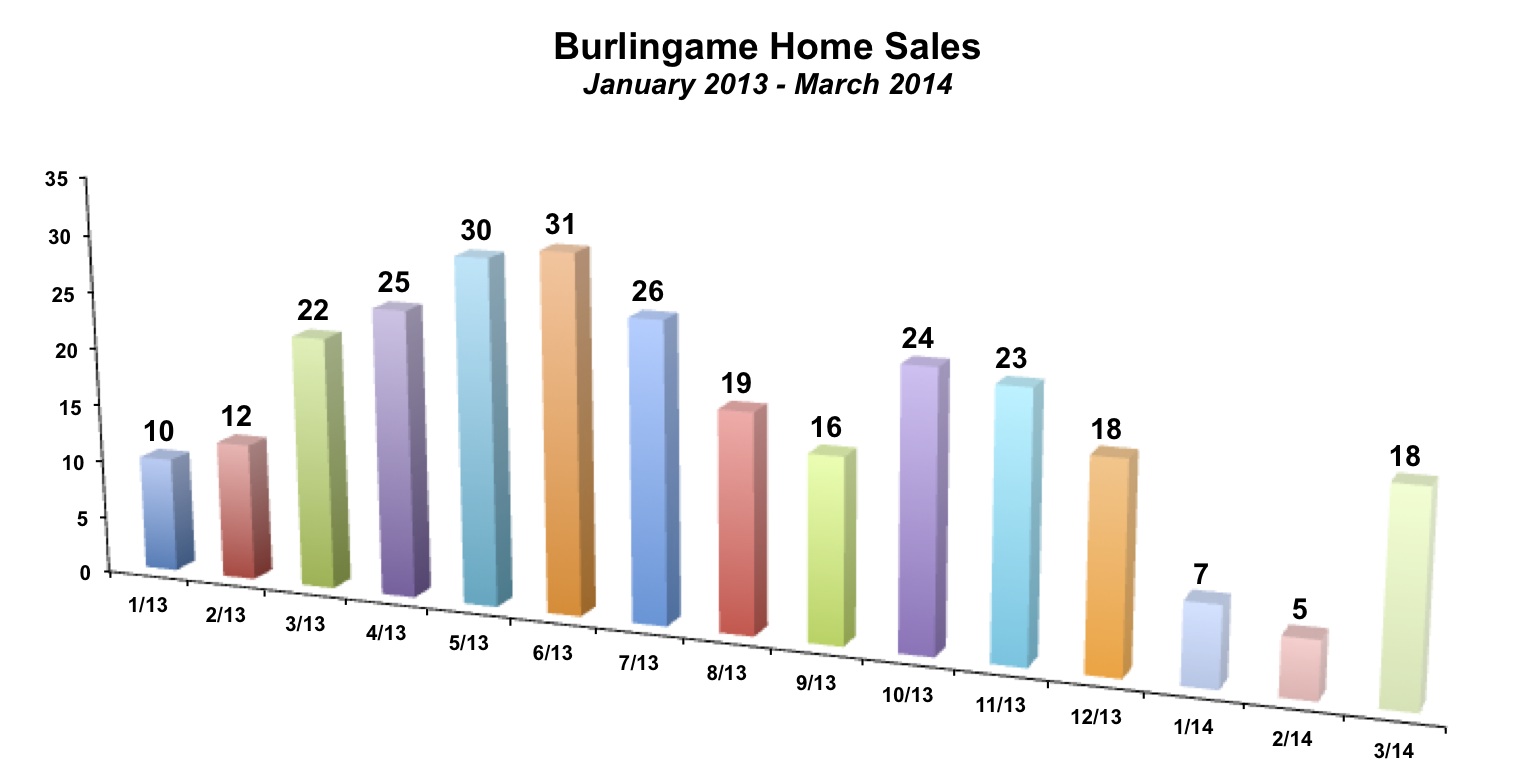
Sales have been hampered by a lack of inventory. Remember, 2013 ended with just 5 unsold homes, a record low level in Burlingame! It was the first time in at least 10 years that there were fewer than 10 homes for sale at the end of a month. Inventory levels have since increased to 18 unsold homes at the end of March 2014. This still remains historically low inventory for the Burlingame market.
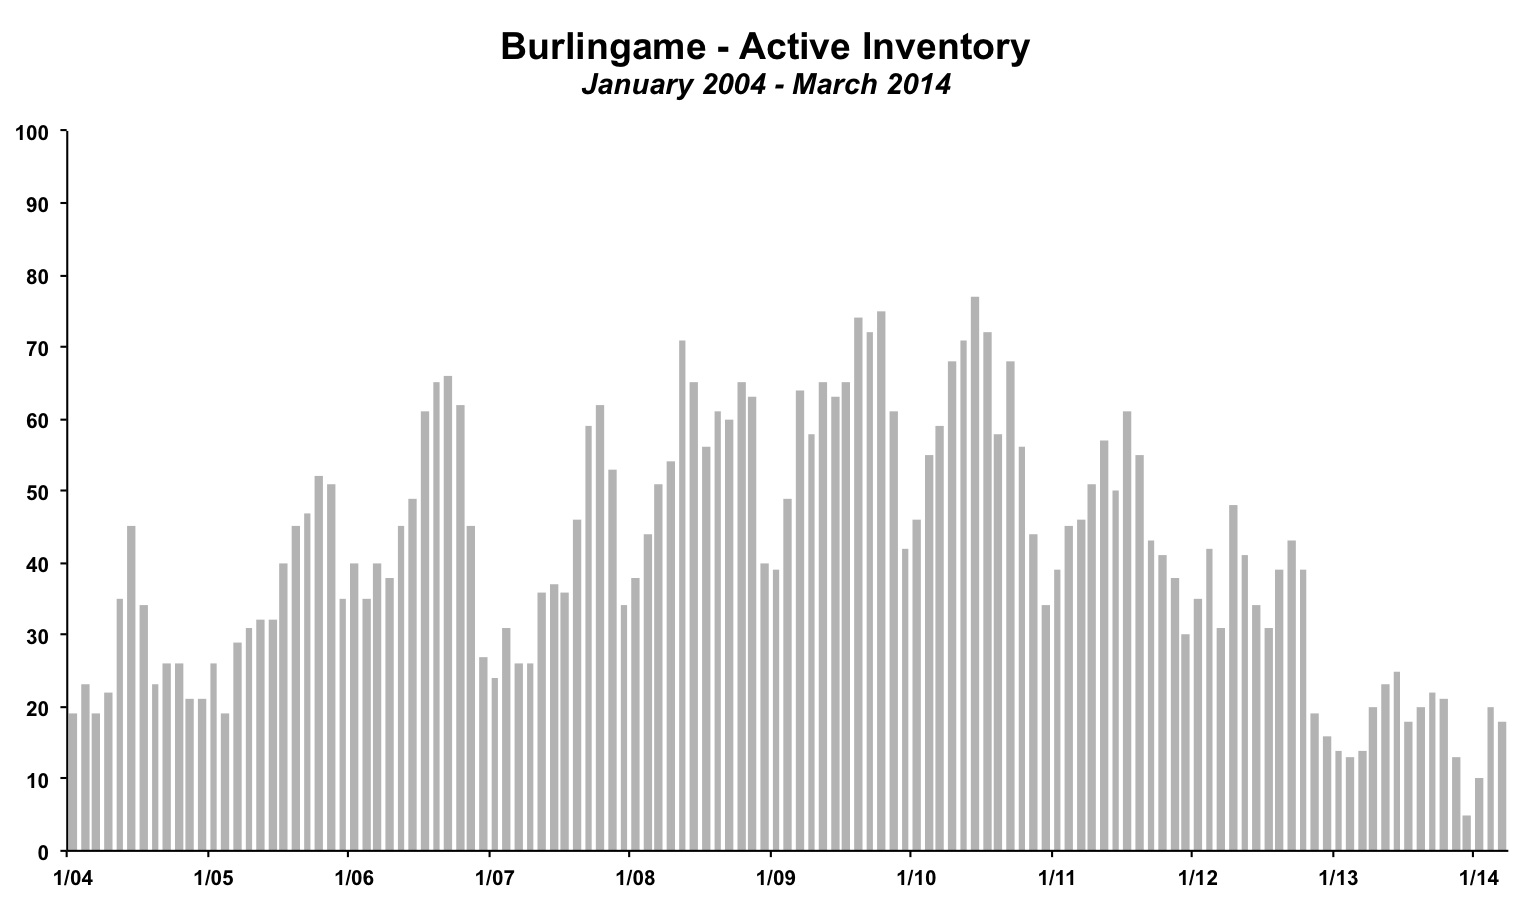
Even the increase from 5 unsold homes in December to 20 unsold homes in February is not that large of an increase. Inventory typically rises throughout the first half of the year. As an example, in 2009, inventory did not change from the beginning of the year to the end of the year, but fluctuated during the year. 2008 ended with 40 unsold homes for sale. 2009 ended with 42 unsold homes for sale, so there was not net for the entire year. During the year, inventory rose to 75 unsold homes at one point. From December 2008 to February 2009, inventory increased from 40 unsold homes to 49 unsold homes. In March 2009, it rose to 64 unsold homes. It is not uncommon even in a timeframe where the underlying "true" inventory is not rising for inventory levels to increase by 15 or even 25 homes in the first few months of the year. Similar to the sales levels, however, this will be something to track closely. A sustained increase in inventory levels above and beyond the normal seasonal pattern would be a sign that the market, which has been clearly favoring sellers for the past few years, could be tipping somewhat back towards a more neutral sign. At this point, the market still strongly favors sellers.
Recent Home Sales in Burlingame
Below is a selection of recent Burlingame real estate sales, sorted by area of Burlingame. As mentioned in previous months, the sub $1 million single family home sales is becoming increasingly rare in Burlingame. While that trend continued in the recent months, perhaps more impressively, none of the sold homes even listed for less than $1 million. There were two 2 bed 1 bath homes. In the recent past these homes regularly sold for less than $1 million. However, given the recent run-up in prices, sellers asked for over $1.1 million in both cases. The homes ended up selling for $1.3 million (221 Stanley Road) and $1.4 million (725 Plymouth Way).Sales of $1,000 per square feet used to be rare. There were about 10 such homes in all of 2013. There were four alone in March 2014. There were no sales under $800 per square feet. This really shows the rate of price increases. November 2013 was the first month that the average price per square foot was above $800 in Burlingame. Just a few months later, every home is selling for more than $800 per square foot. However, this is likely somewhat of an aberration. There will almost certainly be many sales under $800 per square foot in the rest of 2014.
Buyers continue to bid above asking prices. Of the 16 homes sold in the table below, only 3 went for less than the asking price. To get an idea of how hard it is to determine a correct bid, note that four of the homes sold for more than $200,000 above the asking price.

To see all of the latest Burlingame neighborhood specific market updates, click here.
By The Numbers - Burlingame Real Estate
| Current Month | YTD Total or Average | |||
| March 2013 | March 2014 | Jan-Mar 2013 | Jan-Mar 2014 | |
| Sales | 22 | 18 | 44 | 30 |
| Days on Market | 22 | 14 | 33 | 21 |
| Months of Supply | 0.6 | 1.0 | 0.9 | 1.6 |
| Average Price | $1,655,000 | $1,754,000 | $1,638,909 | $1,729,800 |
| Median Price | $1,744,000 | $1,603,000 | $1,666,318 | $1,533,167 |
| Avg $ per Sq Ft | $726 | $880 | $714 | $852 |
Thinking of buying or selling a home in Burlingame?
If you're interested in learning more about the Burlingame real estate market, considering selling your home in Burlingame, or thinking about moving to Burlingame, please drop me a line and I'd love to connect with you.
This article is copyrighted by Raziel Ungar and may not be reproduced or copied without express written permission.


