Hillsborough Real Estate - March 2014

Falling Inventory
Inventory is at historically low levels and more homes are receiving multiple offers above asking prices in the Hillsborough real estate market. Highlights as of March 2014:- The ratio of the sales price to list prices of homes sold in March 2014 was 100.6% in Hillsborough. This is the third time in the last six months the ratio has been above 100%. Since January 2004, it has only been above 100% in twelve separate months.
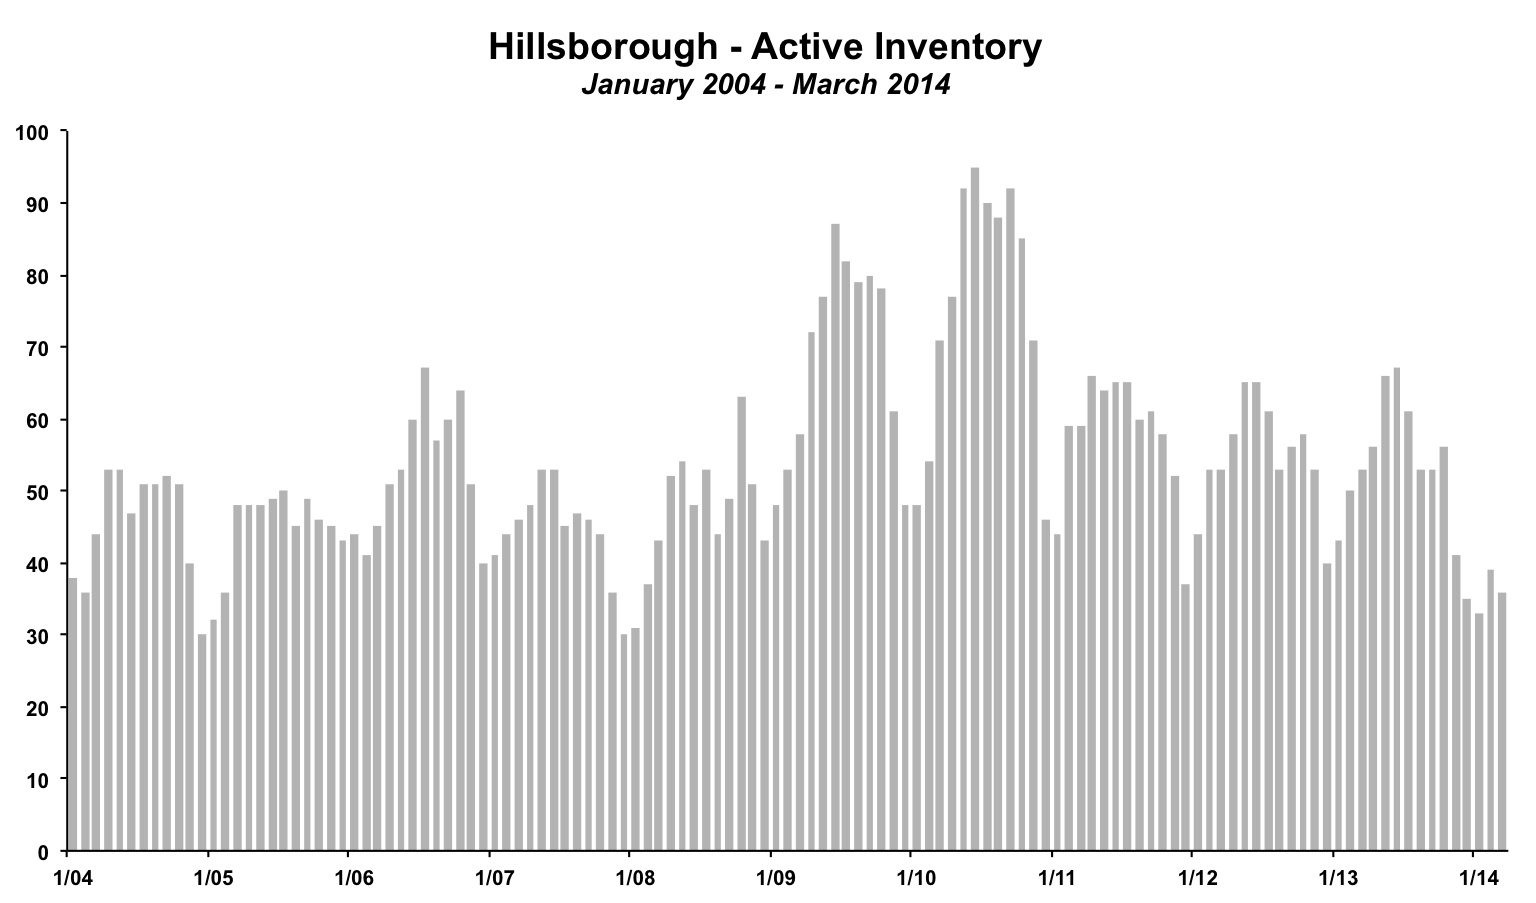
- Inventory is at low levels. There were 36 unsold homes at the end of the month. This is the lowest March inventory in at least 10 years.
The chart below shows the 12 month moving average for median prices, average prices and average price per square foot. Taking a 12 month average helps to smooth out random fluctuations. However, even when doing this, there can still be anomalies. At first glance, it appears prices tumbled in February 2014. What actually happened was that in February 2013, there were a number of high-end homes that sold (high-end even by Hillsborough standards). The average sales price in February 2013 was over $6 million. In February 2014, that month was removed from the 12 month moving average, and replaced by the more modest $2.5 million average sales price in February 2014. The result was a notable decline in the 12 month moving average. This discrepancy began to correct itself graphically in March as prices continued their ascent on a year-over-year basis.

The ratio of average sales price to list price was 100.6% in March 2014. This is the second straight month above 100%. There have been only a handful of instances in the past 10+ years where that has happened in Hillsborough. In most cases, it was during a period where prices were rising. Hillsborough is a bit idiosyncratic and in a neutral market where prices are neither rising nor falling, the ratio is usually in the range of 96% to 97% (in most cities in the mid-Peninsula, neutral is around 100%).

Home Sales Running Ahead of Prior Year Pace
While sales activity was slightly down in March 2014 (11 sales) versus March 2013 (14 sales), in total there has been more sales in 2014 than 2013. Through the first three months of the year, there have been 33 homes sold. Last year in the first quarter of the year, there were 28 homes sold.
At the same time that sales have increased by five homes year-over-year, the number of new listings fell by 12 homes year-over-year. Not surprisingly, more sales and fewer listings is pushing down inventory levels. The inventory of unsold homes at the end of March 2014 stood at 36 listings. This is down from 53 unsold homes at the end of March 2013. It is also the lowest inventory for March in at least ten years. Lastly, inventory declined from 39 homes in February. While a decline of three homes may not seem significant, there is a fairly clear seasonal pattern to inventory. Typically, inventory is lowest in the winter months as fewer people are interesting in buying/selling homes. Inventory rises in the spring and summer before falling again in late fall. In the past ten years, inventory had never declined from February to March, until this year.
Lower inventory often has an upward impact to pricing. With fewer homes for sale, buyers have to compete against each other. The result is more bids above asking prices across the real estate market. We will be keeping a close eye on inventory levels in Hillsborough as we begin to enter what is typically the peak sales months.
By The Numbers - Hillsborough Real Estate
| Current Month | YTD Total or Average | |||
| March 2013 | March 2014 | Jan-Mar 2013 | Jan-Mar 2014 | |
| Sales | 14 | 11 | 28 | 33 |
| Days on Market | 30 | 78 | 52 | 77 |
| Months of Supply | 3.8 | 3.3 | 5.2 | 3.3 |
| Average Price | $2,646,000 | $3,810,000 | $3,651,143 | $3,323,697 |
| Median Price | $2,609,000 | $2,995,000 | $3,290,214 | $3,004,636 |
| Avg $ per Sq Ft | $745 | $854 | $780 | $842 |
Thinking of buying or selling a home in Hillsborough?
If you're interested in learning more about the Hillsborough real estate market, considering selling your home in Hillsborough, or thinking about moving to Hillsborough, please drop me a line and I'd love to connect with you.
This article is copyrighted by Raziel Ungar and may not be reproduced or copied without express written permission.


