Burlingame Real Estate - February 2015
February 2015 - Bidding Wars Continue
Fueled by ongoing low inventory levels, buyers continue to bid above asking prices in Burlingame.Here are the highlights for February 2015 (comparisons are made to data going back to January 2004):
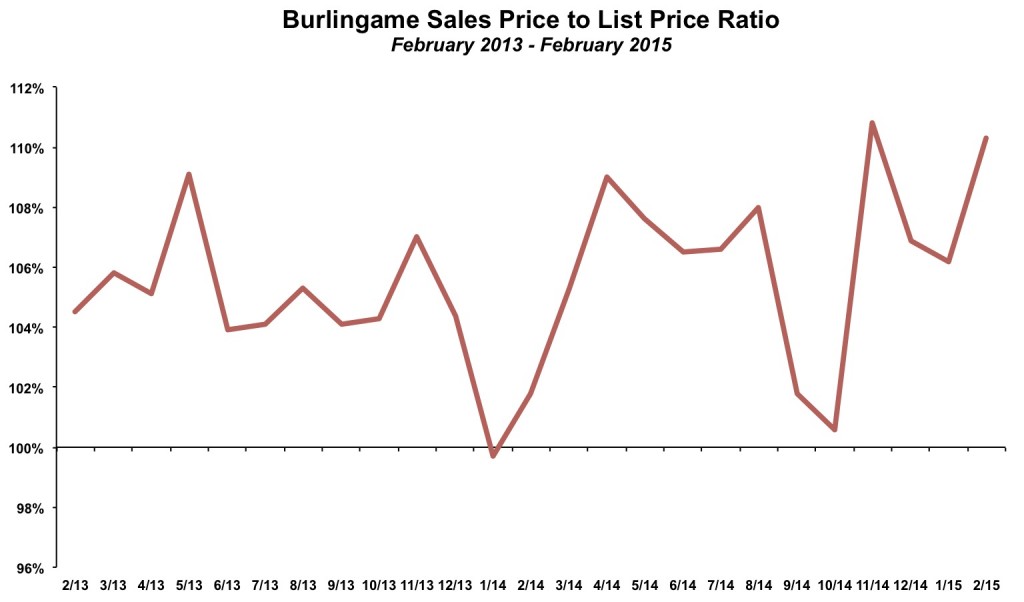
- The sales price to list price ratio was 110.3%, which is only the second time it has been above 110% in the past decade.
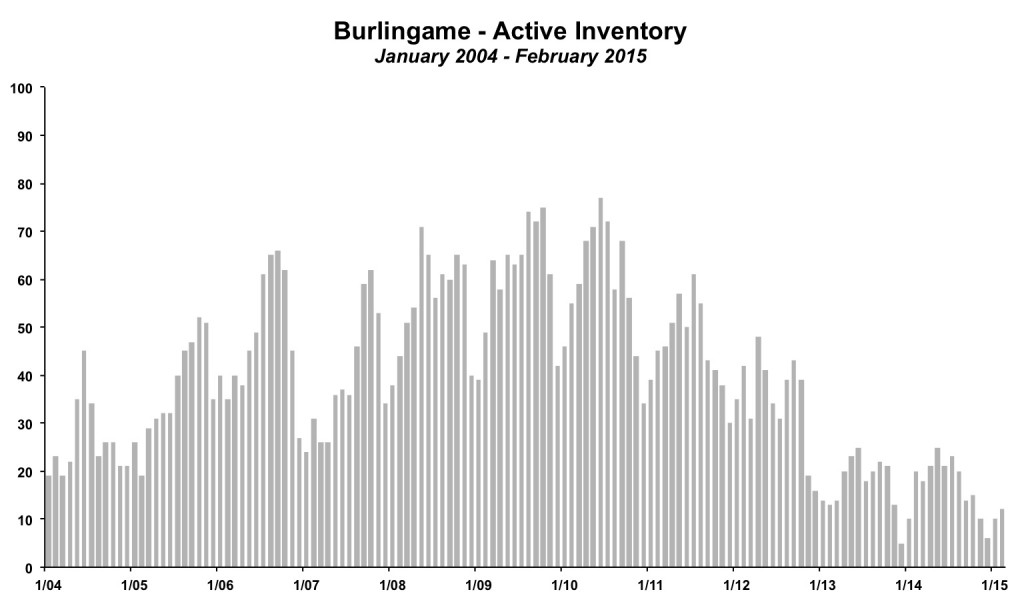
- Inventory remains at record low levels. There were just 12 unsold homes at the end of February, which is the lowest February reading in at least a decade.
- The average price per square foot was $873 in February. On an annual basis, two years ago (2013) it was below $800. Three years ago it was below $700 and four years ago it was below $600. The most amazing thing about the homes in February selling for $873 per square foot is that it isn't amazing at all. That is the new normal for Burlingame.
Akin to the Godfather, just when you think that the bidding wars are over, they pull you back in. In the fall of 2014, we saw the sales price to list price ratio get close to 100% in two straight months. The ratio of sales price to list price is a key indicator of market sentiment. In most markets, such as Burlingame, if the indicator is well above 100%, it is a clear sign of a sellers market, where prices are rising. The two lowish months turned out to be a statistical aberration. The ratio increased sharply for homes sold in November and has remained elevated since then.
The basic premise of the ratio is that new listings are priced based on the sales price of comparable homes recently sold in the area ("comps"). Certainly, in this market there is some shading down of asking prices to encourage multiple offers and bidding wars. However, the basic idea still holds. As prices rise, then the price of comps rise, then list prices rise. If the ratio of sales price to list price remains well above 100%, then it is a good sign that sales prices are also continuing to rise, or at the very least, not decline. Unless we see this ratio fall to 100% or below for a few months in a row, it is a strong sign that prices are at a minimum treading water, and likely are rising.
Moderate Sales Activity to Start the Year
The first few months of the year always a relatively slow time for real estate. Winter holidays, winter weather and inertia mean that market activity slows down with fewer listings and fewer sales. There were 18 homes sold in the first two months of 2015 in Burlingame. This is well above 2014, but overall about average for this time of year.Sales activity continues to be held back by record low levels of inventory in the Burlingame real estate market. There were less than 15 homes for sale at the end of February 2015. Inventory levels should rise throughout the first half of the year in line with seasonal trends. Even a normal increase will still leave inventory levels very low. It could be another year of inventory peaking at less than 30 homes for sale at any given time. Remarkably, from the middle of 2007 to the middle of 2012, there were more than 30 homes for sale at the end of every month (and usually a lot more than 30). This lack of inventory is one of the factors driving prices upward.
To see all of the latest Burlingame neighborhood specific market updates, click here.
By The Numbers - Burlingame Real Estate
| Current Month | YTD Total or Average | |||
| February 2014 | February 2015 | Jan-Feb 2014 | Jan-Feb 2015 | |
| Sales | 5 | 13 | 12 | 18 |
| Days on Market | 42 | 32 | 32 | 28 |
| Months of Supply | 4.0 | 0.9 | 2.5 | 1.2 |
| Average Price | $1,536,000 | $1,711,000 | $1,693,500 | $1,788,500 |
| Median Price | $1,275,000 | $1,530,000 | $1,428,417 | $1,605,000 |
| Avg $ per Sq Ft | $904 | $873 | $809 | $851 |
Thinking of buying or selling a home in Burlingame?
If you're interested in learning more about the Burlingame real estate market, considering selling your home in Burlingame, or thinking about moving to Burlingame, please drop me a line and I'd love to connect with you.
This article is copyrighted by Raziel Ungar and may not be reproduced or copied without express written permission.
=


