Burlingame Real Estate - October 2014


October 2014 - Home Price Appreciation Slowing
Home prices have risen sharply in 2014 in Burlingame. However, it appears that the pace of appreciation has slowed. On a year-over-year basis, prices are still up 10% to 15%.Here are the highlights for October 2014 (comparisons are made to data going back to January 2004):
- Inventory remains at record low levels. There were just 15 unsold homes at the end of October. The previous October low as 21 homes.
- The median sales price was $1.8 million, and was the 3rd highest monthly figure recorded in Burlingame.
- The sales price to list price ratio was 100.4%, which is the lowest since January.
- Point: The average price per square foot in the past three months ($831). In the prior three months ($880). In the three months before that ($886). You have to go to three months prior to that ($801) to find a time where it is lower. Prices haven't flattened, they've fallen. Counterpoint: That's cherry picking the data. Prices are going to fluctuate from month-to-month based on what is sold. Any of the past three months would have been records had they occurred just 12 months ago. Also, the median price paid in October was $1.8 million. The previous high was $1.811 million, so we are still at record levels.
- Point: Prices can't possible rise any further. They've already gone up 40%+ in the past 3 years. Counterpoint: That's misleading. Prices fell a lot and then rose 40%+. Since the last peak in 2007 to today, prices are up about 20% to 25%. Over that same period, we've had 15% of general inflation, so on an adjusted basis prices are only up 5% to 10%. Another factor is that mortgage rates are a lot lower now. In 2007, 30 year fixed rates averaged about 6.3%. In 2014, 30 year fixed rates have averaged about 4.2%. For comparison, the monthly mortgage payment on a $500,000 loan is about $3,100 at the higher rate and $2,450 at the lower rate (21% lower). It's "cheaper" now to buy the same price of home.
- Point: $1.8 million median selling prices! No one can afford a home at this price, surely prices can't rise any further and will probably fall. Counterpoint: The prices being paid today are "real". Buyers are coming in with down payments, verifiable income histories and making their mortgage payments. Yes, current prices are not affordable for many people, but for many workers in the software, biotech and other related fields, these are prices are well within reach. These sectors continue to show dramatic employment growth enlarging the pool of possible buyers. In addition, as you think about life cycles, there are many young folks renting one bedroom apartments for over $3,000 per month in San Francisco. As they grow older, get raises, get married and think about having children they will start to look at Burlingame.
The chart below shows the 12 month moving average (to smooth out random month-to-month variation) of the average price, median price and average price per square foot in Burlingame. Part of the slowdown in the average and median price is due to slightly smaller homes on average being sold in the past six to ten months than in the prior year. This is part of normal fluctuation.

In the past two months, the average home has sold for just above the asking price. In the six months prior, the average home was selling 5% to 10% above the final list price. The ratio of sales price to list price is a key indicator of market sentiment. In most markets, such as Burlingame, if the indicator is well above 100%, it is a clear sign of a sellers market, where prices are rising. In 31 of the last 33 months, the ratio has been above 100%. Often it has been well above 100%, reaching 109% on a handful of occasions. Accordingly, prices have been rising sharply. The recent decline in the ratio could be a sign that prices are starting to flatten. There is too much variability in the data month-to-month to know for sure. Look at the end of 2012/beginning of 2013 and the beginning of 2014. In both cases the ratio dipped lower, only to recover.

Sales Level Moderate in October
There were 22 homes sold in October, which is about what one would expect in Burlingame for this time of year. For the year, sales are down about -12%. Likely, 2014 will end up with about 230 homes sold. This is noticeably down from 2013 (255 homes sold) and 2012 (271 homes sold). However, it is pretty close to "normal". Over the past ten years, there has been an average of 240 sales per year, all the way from a low of 180 sales in 2008 to a high of 311 sales in 2004.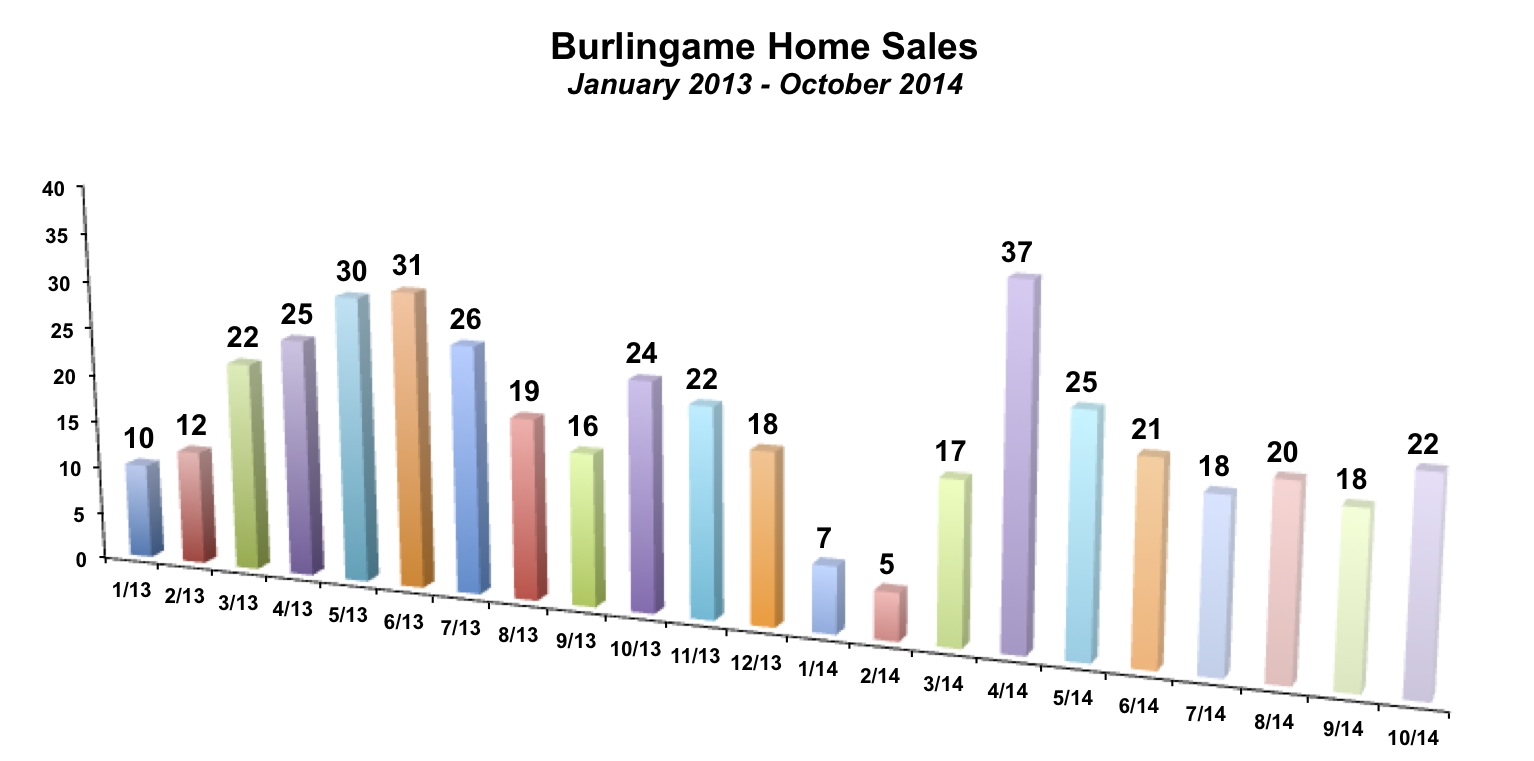
Inventory levels remain at historically low levels in Burlingame. There were just 15 unsold homes for sale in the city at the end of October 2014. This is the first time October inventory levels were below 20 homes in at least ten years.
Fewer homes being sold is directly related to fewer homes for sale. As an approximation, we can think of all of the possible sales in the first ten months of the year being represented by any home unsold at the end of the prior year and any new listing during the first ten months of the year. (In reality, there are some complicating issues, such as some of the listings represent homes taken off the market and then re-listed, but overall it is a helpful guide). In 2014, there have been 190 homes sold in the first ten months of the year. There were 5 homes unsold at the end of 2013 and there have been 241 homes listed through the end of October (not all of which have been on the market long enough to show, let along even sell). So out of a total maximum of 246, there has been a "success" ratio of 77%. Last year at this time, the success ratio was about the same, at just under 80%. In 2012, the year with the highest level of sales since 2004...the success ratio was far lower at 71%.

Recent Home Sales in Burlingame
Below is a selection of recent Burlingame real estate sales, sorted by area of Burlingame. These individual sales encapsulate a lot of the trends we are seeing in the marketplace.We had a sub-$1 million sale this month. A 2 bed, 1 bath, 1,270 square foot home on Larkspur in Burlingame Gardens sold for $975,000. Single family homes going for less than $1 million are an increasingly rare breed in Burlingame.
The slowdown in sales price to list price ratio is somewhat evident, but there are a lot of subtleties. On the face of it, of the 18 homes sold in the sample below, 7 went below the asking price, 1 sold at the asking price and 10 went above the asking price. This is definitely a lower ratio than we saw in the summer. But, we also saw a continuation in the days on market effect. Not surprisingly, the longer a home is on the market, the greater chance it will sell for less than asking. Among the six homes that were on the market at least 3 weeks (21 days), 5 went below asking and the one outlier went for $5,000 above the final list price. Among the 12 homes selling in less than 3 weeks, only two went below the asking price. Patient buyers who don't mind missing out on a lot of properties can save some money by waiting a few weeks and then offering 2% to 5% below asking. Buyers who want a particular home still need to strongly consider bidding above the asking price. The best bid will of course vary by listing. Working with a local, knowledgeable Realtor can help.

To see all of the latest Burlingame neighborhood specific market updates, click here.
By The Numbers - Burlingame Real Estate
| Current Month | YTD Total or Average | |||
| October 2013 | October 2014 | Jan-Oct 2013 | Jan-Oct 2014 | |
| Sales | 24 | 22 | 215 | 190 |
| Days on Market | 24 | 31 | 25 | 18 |
| Months of Supply | 0.9 | 0.7 | 0.9 | 1.0 |
| Average Price | $1,548,000 | $1,739,000 | $1,648,744 | $1,757,700 |
| Median Price | $1,540,000 | $1,800,000 | $1,597,233 | $1,645,442 |
| Avg $ per Sq Ft | $762 | $837 | $753 | $858 |
Thinking of buying or selling a home in Burlingame?
If you're interested in learning more about the Burlingame real estate market, considering selling your home in Burlingame, or thinking about moving to Burlingame, please drop me a line and I'd love to connect with you.
This article is copyrighted by Raziel Ungar and may not be reproduced or copied without express written permission.


