San Carlos Real Estate - March 2014

Prices Still Rising Rapidly in San Carlos
Frenzied bidding wars continued in the San Carlos real estate market. Buyers bid well above asking prices and excuse the analogy, but homes flew off the shelf. The average days on market for homes sold in March 2014 was just 8 days.Here are the highlights as of March 2014 (as compared to data since early 2004):
- Bidding wars continue. The average sales price to list price ratio was 114%, the 2nd highest ever in San Carlos (February 2014 was higher) and one of the highest monthly values recorded in the mid-Peninsula.
- The average days on market of homes was just 8 days, the lowest in at least the past ten years in San Carlos.
- The average price ($1,438,000), median price ($1,426,000) and average selling price ($811) were all the 2nd or 3rd highest monthly values ever.
While prices surpassed their previous late 2007/early 2008 peak in mid-2013, this was just in nominal terms. Regular inflation has been eating away at the value of a dollar. Since 2007/2008, inflation has totaled about 10%. Coincidentally, current price levels in San Carlos are about 10% to 15% above where they were at the previous peak. The bottom line is the current prices are now at their highest ever, even after adjusting for inflation.

Bidding wars continue to be the norm in San Carlos and if anything in the past few months they have intensified. The average ratio of sales price to list price was 114% in March 2014. Normally, we would say that this might be the highest ratio seen in any area of the Peninsula in the past 10 years. However, it was actually higher in February 2014! A reading above 100% is a sign that buyers outnumber sellers. Readings this far above 100% suggest that it is a buyer's frenzy out there.

Sales Pick-up in March Along Normal Seasonal Trends
March seems to be the unofficial start of the selling season in San Carlos. As is typical for most areas, sales activity is lowest in the winter months and then peaks in late summer. Matching this normal seasonal pattern, there were 25 homes sold in San Carlos, the most since October 2013. Through the first three months of 2014 there have been 52 homes sold, up from 48 sales in the same timeframe as the year prior.
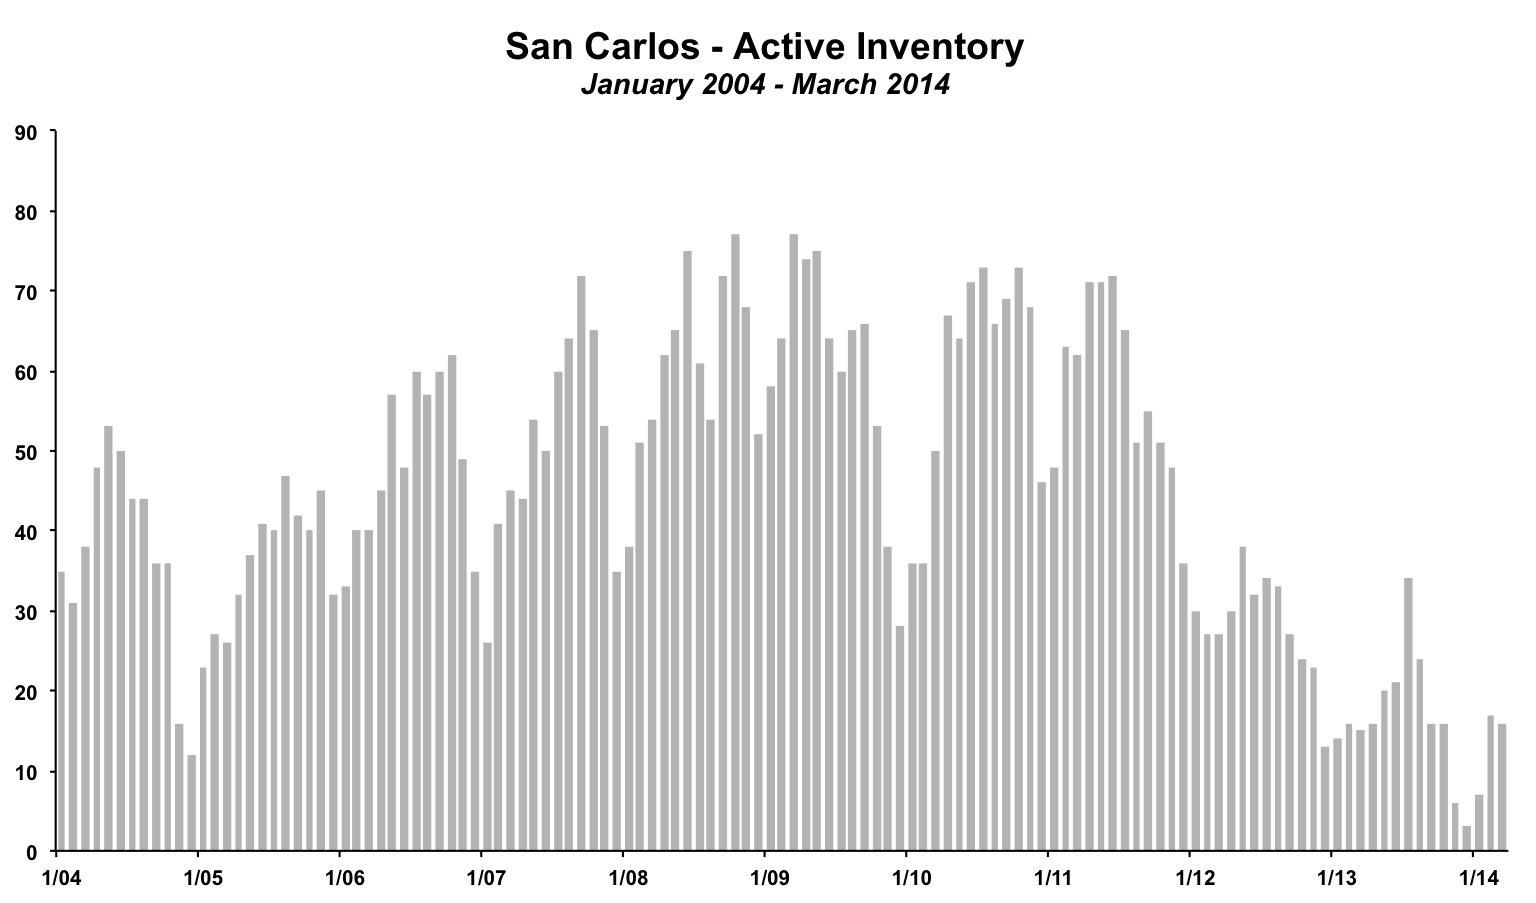
Inventory levels have rise since reaching some of the lowest levels ever recorded in San Carlos at the end of 2013. Still, with just 16 unsold homes on the market at the end of March 2014, inventory remains at historically low levels in the San Carlos real estate market. Low inventory has a predictable response. The lack of supply causes buyers to compete against each other over the same listings. This drives selling prices above list prices.
By The Numbers - San Carlos Real Estate
| Current Month | YTD Total or Average | |||
| March 2013 | March 2014 | Jan-Mar 2013 | Jan-Mar 2014 | |
| Sales | 23 | 25 | 48 | 52 |
| Days on Market | 18 | 8 | 24 | 15 |
| Months of Supply | 0.7 | 0.6 | 1.0 | 0.7 |
| Average Price | $1,334,000 | $1,438,000 | $1,237,458 | $1,437,442 |
| Median Price | $1,295,000 | $1,426,000 | $1,192,292 | $1,385,577 |
| Avg $ per Sq Ft | $671 | $811 | $624 | $821 |
Thinking of buying or selling a home in San Carlos?
If you're interested in learning more about the San Carlos real estate market, considering selling your home in San Carlos, or thinking about moving to San Carlos, please drop me a line and I'd love to connect with you.
This article is copyrighted by Raziel Ungar and may not be reproduced or copied without express written permission.


