Burlingame Real Estate - July 2013

July 2013 - No SIgn of Slowdown
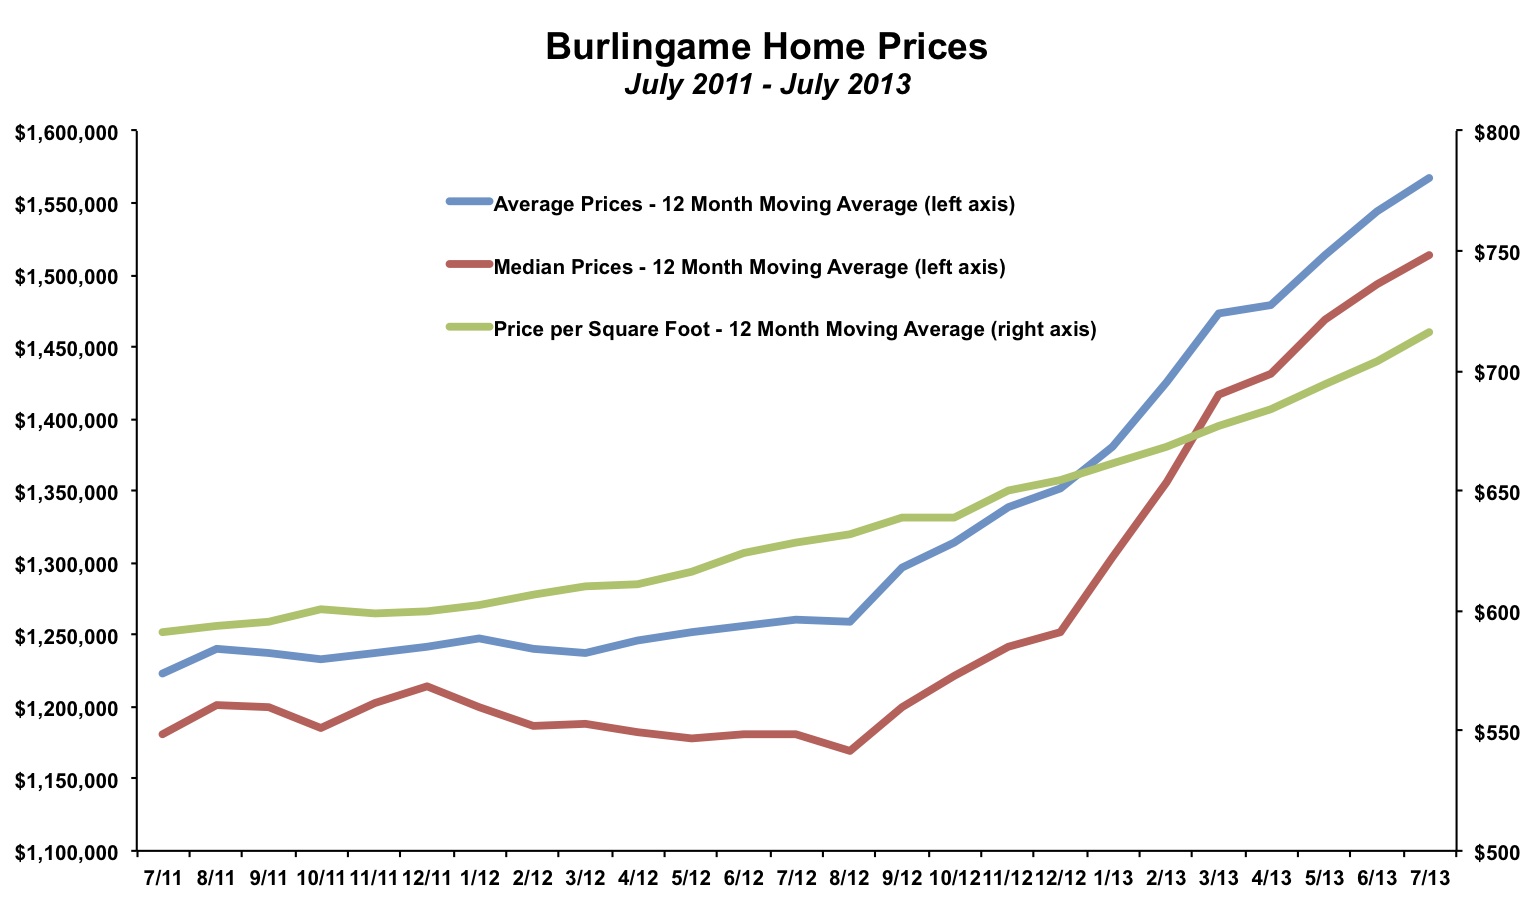
It remains a decidedly sellers market in Burlingame. Prices are at record levels and rising, inventory is at record lows and falling, and buyers continue to outbid each other as most homes sell quickly. Here are the highlights for July 2013 (comparisons are made to data going back to January 2004)- The median and average selling prices for the month were above $1.5 million for the 6th time in the last 7 months.
- The average price per square foot of $788 was the highest ever. It has been above $780 the past three months. Prior to the recent run the previous high was $763 per square foot in August 2007.
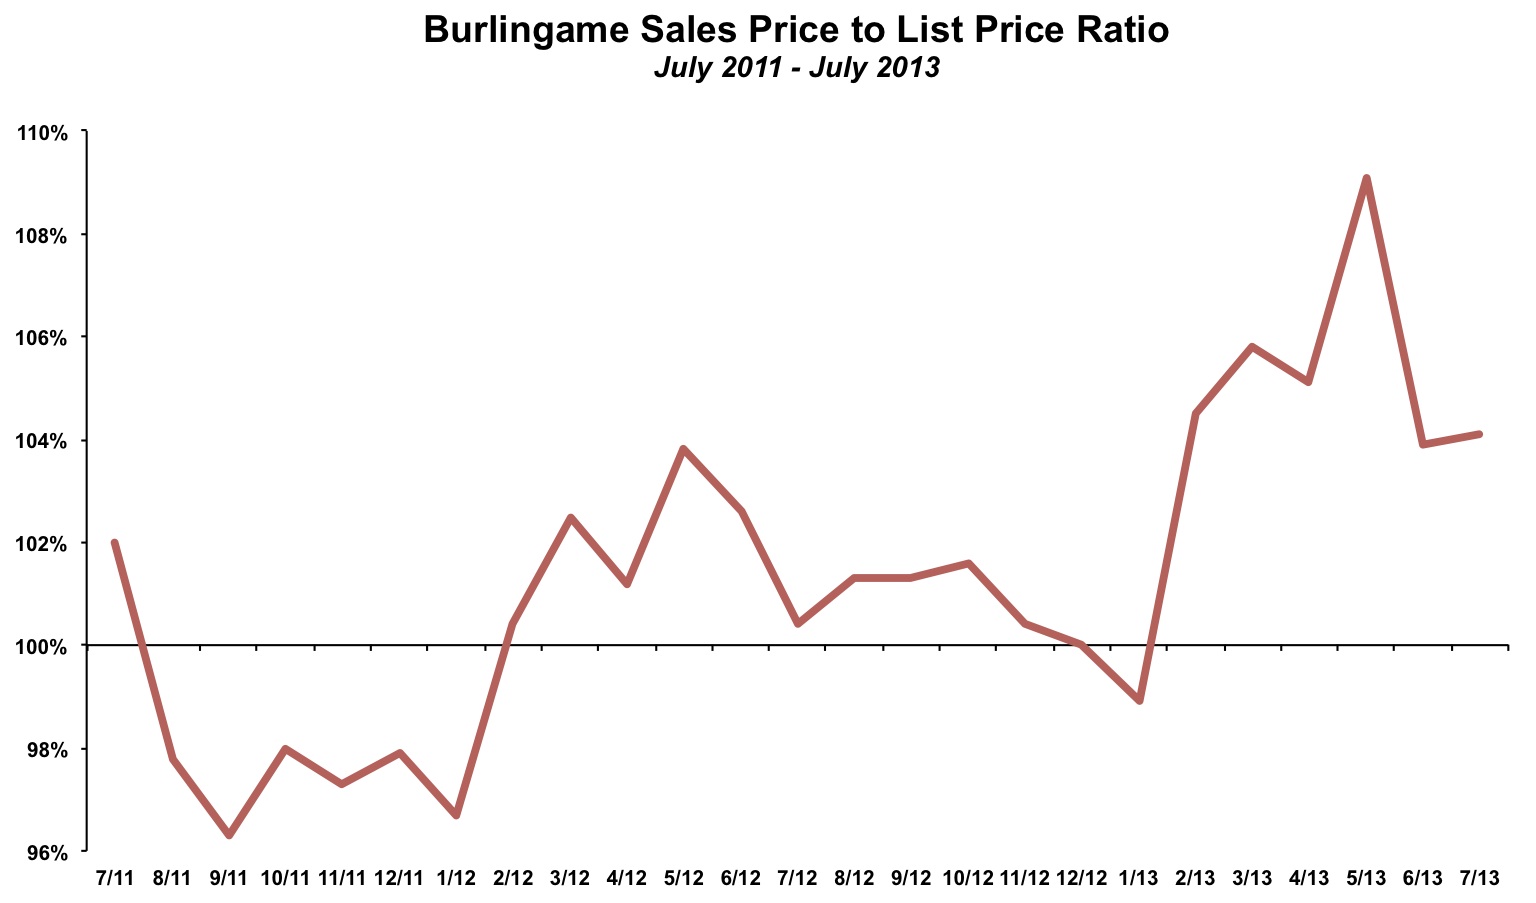
- The sales price to list price ratio was 104.1%. It has been at or above 100% in 17 of the last 18 months.
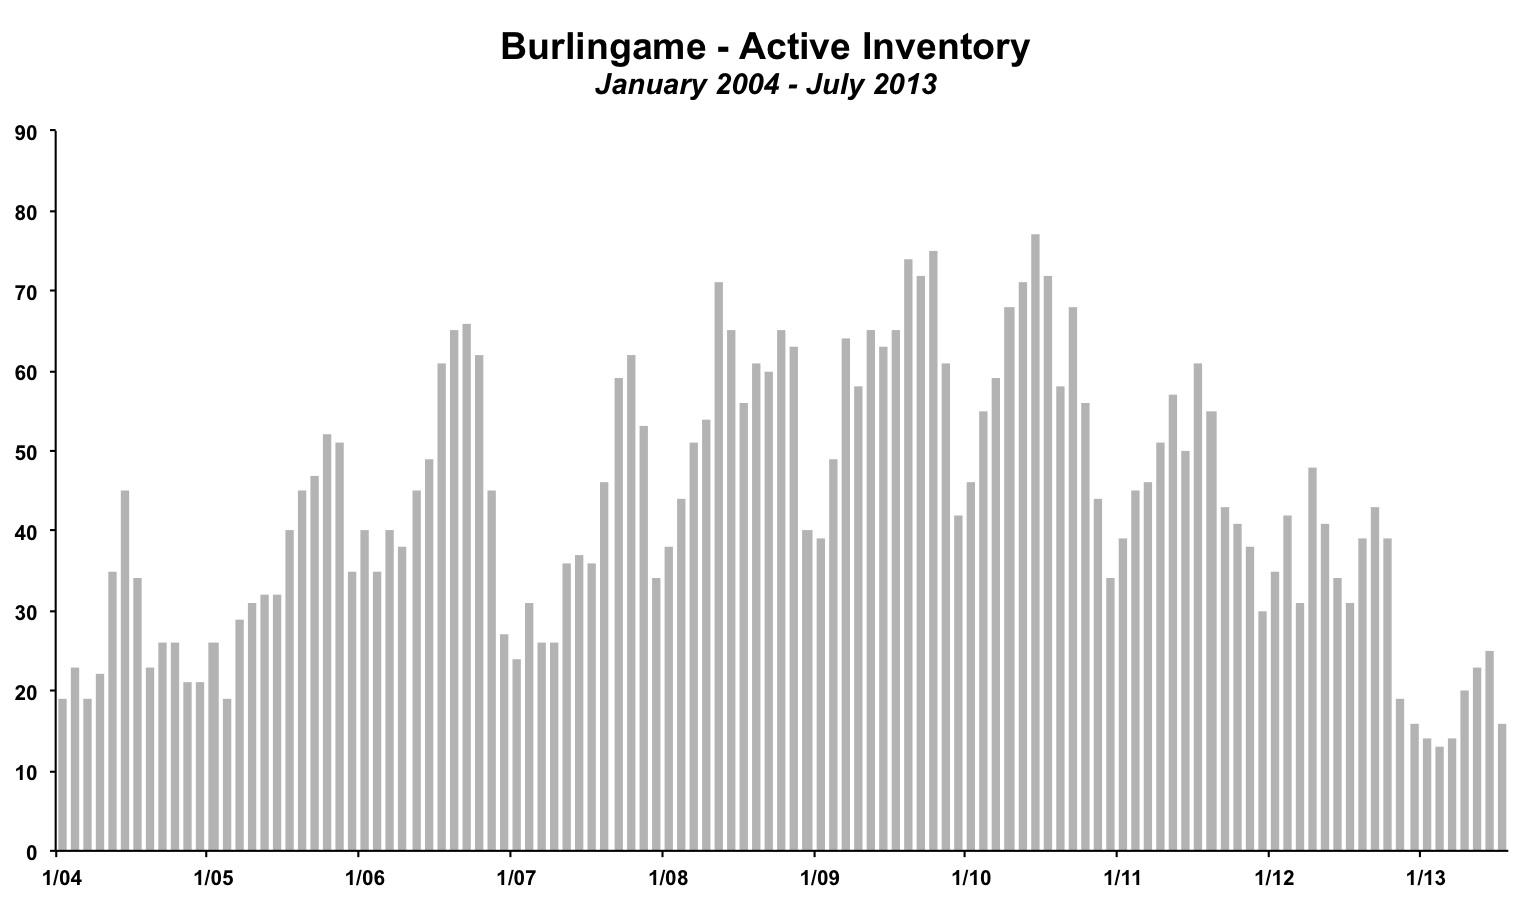
- Inventory declined to 16 unsold homes, one of the lowest readings ever in Burlingame, especially for the middle of summer.
On a year-over-year basis, prices have increased by about 15%. Since reaching bottom in the middle of 2011, prices have risen more than 20%.
The average sales price to list price ratio remains well above 100% suggesting that buyers continue to bid against each other on a regular basis. In July 2013 the ratio was 104.1%. This ratio is often a leading indicator. When it rises and stays above 100% it often signals rising prices, and vice versa when it falls it can signal flat to declining prices. Right now the indicator is signaling continued price increases.
Steady Number of Sales in July
There were 25 homes sold in Burlingame in July 2013. In the first seven months of the year, there have been 155 homes sold, about even with the 157 sales in the first seven months of 2012. Sales activity is flat at the same time that the number of newly listed homes is down 14%.
Inventory, which is typically higher in the summer, unexpectedly declined in July to just 16 unsold homes at the end of the month. In the last ten years, July inventory has been between 30 and 70 homes, so having just 16 listings left is historically low. One measure of inventory that accounts for how many sales there are in an area is the months of supply. It shows how many months it would take to clear the current inventory at the most recent monthly sales rate, assuming there were no new listings. In July 2013, it was just over 0.6 months, the lowest in the last ten years in Burlingame. A lack of supply, coupled with continued strong buyer demand points to sustained upward pressure on prices.
Recent Home Sales in Burlingame
Below is a selection of recent Burlingame real estate sales, sorted by area of Burlingame. As you can see, most homes continue to sell above the asking price; of the 21 homes shown below, 14 sold for more than the asking price and 1 sold for equal to the final asking price. Of the 6 listings that went for less than the final list price, the average price per square foot was $669, well above the level seen in the past few years. The minority of homes that are going under the asking price are often cases where sellers are pricing too far ahead of the market, instead of examples of weakness in the market.Homes continue to sell extremely fast. The majority of homes that end up selling are gone in less than two weeks, and only a handful remain on the market for more than four weeks.
Although still uncommon, the $1,000 per square foot is being increasingly breached. Three recent homes, 604 Bayswater, 807 Acacia and 1321 Paloma (a listing of mine) all sold for more than $1,000 per square foot. One thing they all have in common are smaller footprints with square footage in the 1,000 to 1,100 range. For comparison, there was only one home above the $1,000 per square foot mark in 2012.

To see all of the latest Burlingame neighborhood specific market updates, click here.
By The Numbers - Burlingame Real Estate for 2013
| Current Month | YTD Total or Average | |||
| July 2012 | July 2013 | Jan - Jul 2012 | Jan - Jul 2013 | |
| Sales | 31 | 25 | 157 | 155 |
| Days on Market | 38 | 25 | 34 | 27 |
| Months of Supply | 1.0 | 0.6 | 1.7 | 0.8 |
| Average Price | $1,340,000 | $1,608,000 | $1,310,611 | $1,656,232 |
| Median Price | $1,300,000 | $1,538,000 | $1,221,248 | $1,606,806 |
| Avg $ per Sq Ft | $645 | $788 | $646 | $754 |
Thinking of buying or selling a home in Burlingame?
If you're interested in learning more about the Burlingame real estate market, considering selling your home in Burlingame, or thinking about moving to Burlingame, please drop me a line and I'd love to connect with you.
This article is copyrighted by Raziel Ungar and may not be reproduced or copied without express written permission.


