Bidding Wars Continue in Belmont
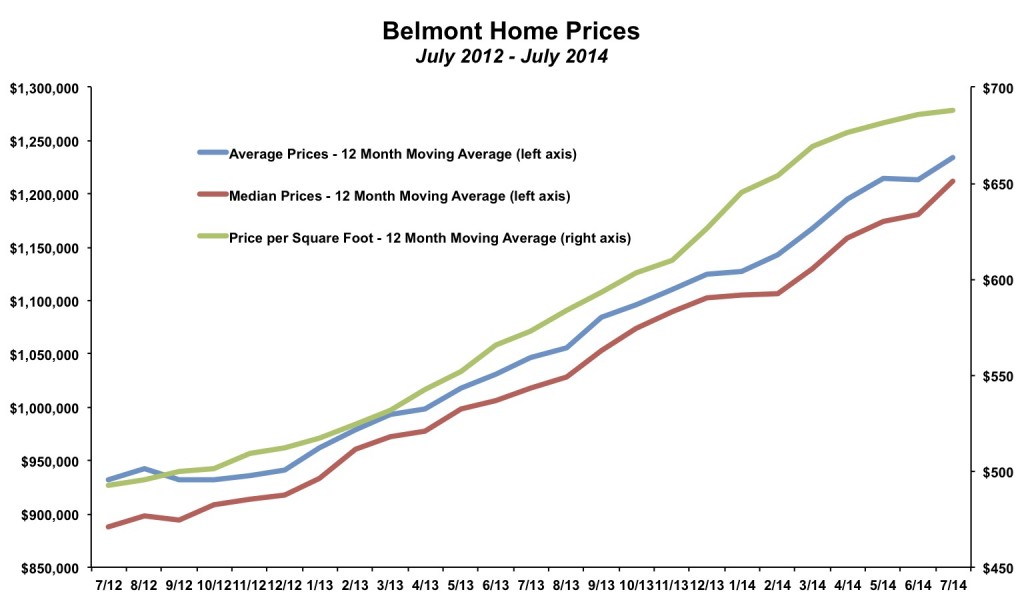
Prices continue to rise in the Belmont real estate market as buyers regularly bid 5%, 10% or even more above asking prices. Here are some highlights for the Belmont real estate market through July 2014:- The price per square foot has averaged above $700 this year. Prior to 2014, it did not breach $700 in any single month.
- Due in part to a few larger homes selling, the average price of $1,421,000 and the median price of $1,475,000 in July were the highest even in Belmont.
- Homes are selling very quickly. The average time spent for-sale amongst homes that eventually sold has been just 15 days. Many homes sell in about a week after a single open house.
Judging by the ratio of sales price to list price, Belmont has seen the most sustained level of overbids across San Mateo County. Across the county, the average single family home sold for 5% above the final asking price in 2013, and has sold for 6% above the final asking price so far in 2014. In Belmont, the average home sold for an incredible 9% above the asking price in 2013! So far, 2014 has seen an even greater imbalance with the average sold home going for more than 10% above the asking price.
Home sales jumped sharply in Belmont from 2011 to 2013 and inventory levels dropped. So far in 2014, inventory levels remain at historic lows. There were just 19 unsold homes in Belmont as of the end of July 2014. Inventory levels have pretty much bottomed out. There will always be some inventory at a given point in time because of newly listed homes that have not sold yet. Low inventory and fewer new listings has depressed the number of homes sold in the area. Through the first seven months of 2014, 125 homes sold. In the same period in 2013, there were 149 sales. Nearly every home is selling...there just are not as many home for sale.
A lack of inventory will likely continue to put upward pressure on prices. Buyers should expect to compete against multiple offers for most listings. Most sellers are expecting to receive offers above their asking price (versus hoping/wishing as in normal real estate market periods).
By The Numbers - Belmont Real Estate
| Current Month | YTD Total or Average | |||
| July 2013 | July 2014 | Jan-Jul 2013 | Jan-Jul 2014 | |
| Sales | 27 | 24 | 149 | 125 |
| Days on Market | 21 | 23 | 20 | 15 |
| Months of Supply | 0.7 | 0.8 | 0.7 | 1.0 |
| Average Price | $1,170,000 | $1,421,000 | $1,117,195 | $1,308,400 |
| Median Price | $1,100,000 | $1,475,000 | $1,077,081 | $1,284,360 |
| Avg $ per Sq Ft | $632 | $657 | $618 | $709 |
Thinking of buying or selling a home in Belmont?
If you're interested in learning more about the Belmont real estate market, considering selling your home in Belmont, or thinking about moving to Belmont, please drop me a line and I'd love to connect with you.
This article is copyrighted by Raziel Ungar and may not be reproduced or copied without express written permission.
=


