Burlingame Real Estate - October 2013
October 2013 - Another Month - Still a Seller's Market
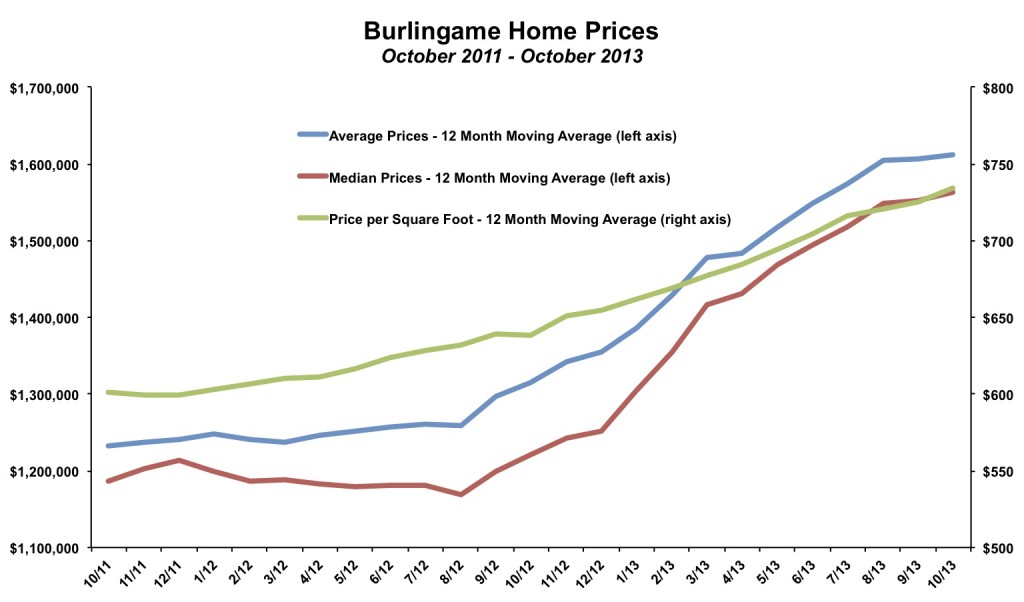
In what is probably beginning to sound like a broken record to anyone reading these reports, the Burlingame real estate market continues to favor sellers. Prices are at record levels and rising, inventory is near record lows (thought still many great homes out there for buyers), and most homes continue to sell quickly. Here are the highlights for October 2013 (comparisons are made to data going back to January 2004):- The average price per square foot of $762 was the sixth straight month above $750. The record annual price per square foot was $703 in 2007. That will surely be eclipsed in 2013.
- The sales price to list price ratio was 104.3%. It has been at or above 100% in 20 of the last 21 months.
- Most homes continue to sell quickly; the average home sold in 24 days in October 2013.
- If the ultimate sign of success for a seller is a sold home, 2013 has been more successful than any year in the last decade. Less than 10% of listings have expired or been cancelled (some of which are sellers changing their minds or timing, not necessarily a failure to sale). In each year from 2006 to 2011, more than 30% of listings expired or were cancelled. Even in the red hot year of 2004, 14% of listings expired or were cancelled.
On a year-over-year basis, prices have increased by 15% to 20%. Since reaching bottom in the middle of 2011, prices have risen by approximately 25%.
Prices cannot rise 15% year-after-year forever (assuming general inflation remains in the low single digits), even if every company in the Bay Area IPOs successfully. How long can prices continue to rise? The honest answer is that no one truly knows. Just because there has been a run-up for the past 18 to 24 months does not mean that the market has run out of steam. If history is any guide, steady price increases can be sustained for much long than two years. From the mid 90s to the mid 2000's prices rose every year in California. The same thing occurred in the greater Bay Area, with the exception of a few down years in the 2001 tech crash.
On average, homes continue to sell for more than their asking, though many homes are going at or even below the final list price as sellers price based on rising comps. (See our review of recent home sales for more detail).
The average sales price to list price ratio has been above 100% almost since the beginning of 2012. The ratio is often a leading indicator. When it rises and stays above 100% it signals rising prices, and vice versa when it falls it can signal flat to declining prices. The indicator remains at an elevated level, suggesting further price increases. We will watch it closely.
Sales Activity Modestly Steady in September
There were 24 homes sold in Burlingame in October 2013, a bit below the 28 homes sold in October 2012, but well above the 13 homes sold in October 2011. In the first ten months of the year, there have been 215 homes sold, down slightly from the the 228 sales through the same period in 2012. With just seven more sales up to this point, 2013 will have had more activity than any year between 2007 and 2011.However, that being said, there is a perception out there that there are so few places for sale; while there are fewer homes to choose from at any given moment given low average days on market, the fact that only a slightly lower number of buyers are still being successful buying homes is still a very encouraging sign. The "no inventory" concept does not carry much weight in the sense that homes are just selling faster, so buyers do not have as much time to see the home, but there is still the same opportunity.
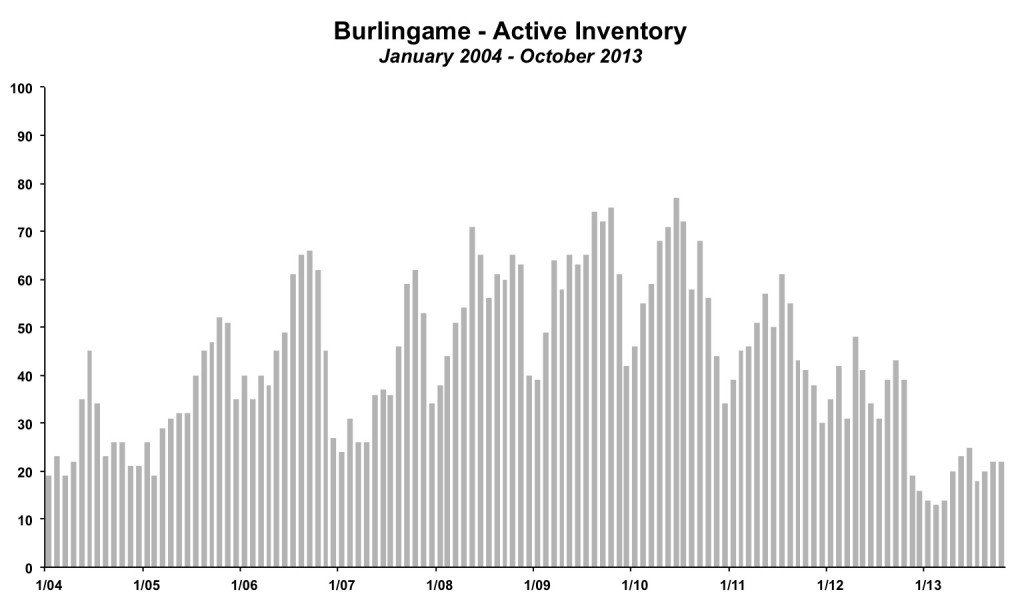
Sales are being hampered by a lack of new listings. There have been only 255 new listings through October, down 12% from the 291 homes listed in the first ten months of 2012. There have been fewer listings in 2013 than any of the past ten years.
Relatively few listings combined with modestly high sales activity has resulted in record low inventory levels. At the end of October 2013, there were just 22 homes on the market, as compared to 39 homes for sale at the end of October 2012.
Recent Home Sales in Burlingame
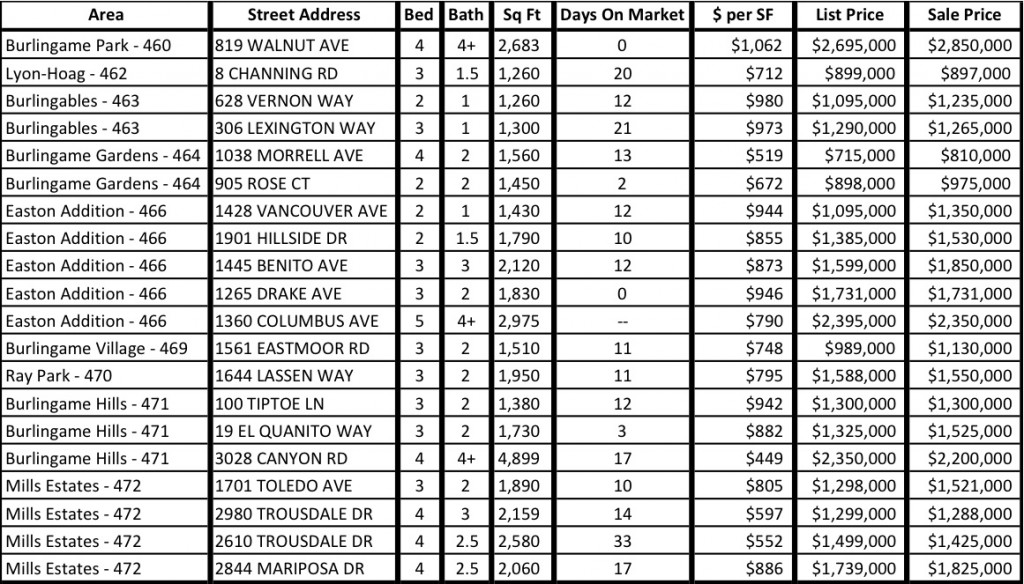
Below is a selection of recent Burlingame real estate sales, sorted by area of Burlingame. These 20 sales provide a good cross section of the local real estate market. Most homes continue to sell quickly. Only four of the homes were on the market for more than two weeks. However, we are not seeing as many homes sell immediately. Only five homes sold in less than a week.While on average, homes continue to sell for more than the asking price, it varies by listing to listing. Of the 20 sales, 12 went above asking, two sold for the asking price and seven went for less than the asking price.
All but four of the homes sold for more than $1.2 million. Sub $1 million sales are becoming increasingly rare in Burlingame. Two of the sub $1 million sales were smaller homes. The 3 bed home on Channing in Lyon Hoag sold for $897,000, about even with the list price. It had previously sold in April 2005 for $835,000. The 4 bed, 2 bath on Morrell in Burlingame Gardens was a trust sale and in need of updating.
To see all of the latest Burlingame neighborhood specific market updates, click here.
By The Numbers - Burlingame Real Estate for 2013
| Current Month | YTD Total or Average | |||
| October 2012 | October 2013 | Jan - Oct 2012 | Jan - Oct 2013 | |
| Sales | 28 | 24 | 228 | 215 |
| Days on Market | 21 | 24 | 31 | 25 |
| Months of Supply | 1.4 | 0.9 | 1.7 | 0.9 |
| Average Price | $1,471,000 | $1,548,000 | $1,356,654 | $1,648,744 |
| Median Price | $1,400,000 | $1,540,000 | $1,264,675 | $1,597,233 |
| Avg $ per Sq Ft | $660 | $762 | $655 | $753 |
Thinking of buying or selling a home in Burlingame?
If you're interested in learning more about the Burlingame real estate market, considering selling your home in Burlingame, or thinking about moving to Burlingame, please drop me a line and I'd love to connect with you.
This article is copyrighted by Raziel Ungar and may not be reproduced or copied without express written permission.

