San Carlos Real Estate - October 2014
Bidding Wars Continue in San Carlos
Many homes continue to sell for well above asking prices in the San Carlos real estate market as buyers compete against one another. Here are the highlights as of October 2014 (as compared to data since early 2004):- Bidding wars continue. The average sales price to list price ratio was 106.6% in October (the 21st straight month above 105%). However, as always, not all homes are selling above their asking price. Seeing the run-up in values, some sellers are pricing ahead of the market and eventually selling at or below their asking prices. This makes it tough for buyers trying to figure out whether they need to go $200,000 over asking or should try to bargain for $50,000 under asking.
- Most homes continue to sell quickly. The average days spent on market amongst sold home was just 17 days in October.
- There were 15 unsold homes at the end of October This is the lowest level of inventory in October in San Carlos in the past ten years.
As measured by the ratio of sales price to list price, San Carlos continues to see some of the highest bidding wars anywhere in the mid-Peninsula. Buyers have regularly been paying well above asking prices since early 2013. A "normal" ratio is around 100%, which means that on average, homes that end up selling go for their asking price. For most of 2014, the ratio has been above 110%, which is unheard of in most markets in any period. In the past few months, the ratio has dipped to a still-high 106%. The ratio was 106.6% in October 2014 (to put that into perspective, the highest monthly ratio in all of San Mateo County in the past ten years was 107.7%, in April 2014).
Sales Down Slightly From Last Year
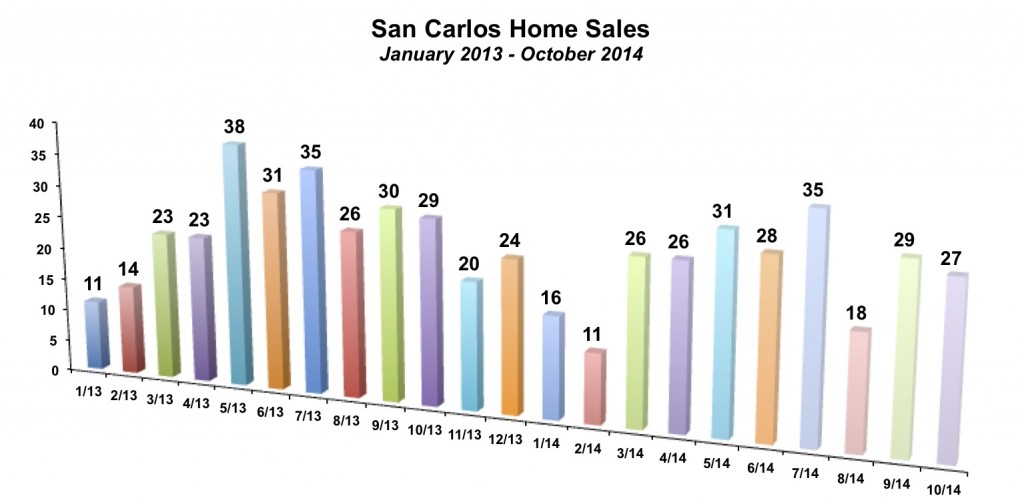
The sales pace in 2014 has been slightly below 2013. Through the first ten months of 2014 there have been 247 homes sold, down from 260 sales in the first ten months of 2013. Barring an unexpectedly busy last two months of the year, sales will fall just short of 300 transactions for the year. That is about normal for the San Carlos real estate market. In 2012 and 2013, sales barely exceeded 300 homes. In the six years prior, annual sales totals ranged from 236 to 296.A slowdown in sales activity is often one of the first signs that a real estate market is slowing, though it can take time. For example, in 2004, there were 417 homes sold. Sales activity slowed sharply, down to 357 homes sold in 2005, 296 homes sold in both 2006 and 2007, and down to 262 sales in 2008. Buyers who saw sales start to slow in 2005 might have thought "Aha!, I bet prices will start to decline." While they were right, eventually, they would have waited until the middle of 2009 for prices to return to their 2005 levels. In the meantime, prices were rising sharply. The moral of the story is that while a slowdown in sales activity can signal a shift in the market, the reaction can be very delayed.
The story is a little bit different in San Carlos today, than it was 10 years ago. Back then, the slowdown in sales was also accompanied by a rise in inventory levels (see chart below). Homes were increasingly going unsold. Today, sales are slow because there are so few listings coming up for sale. 2014 is on pace to have about 315 new listings, which would be the fewest in at least ten years. The average has been close to 400 new listings per year. Inventory of for-sale homes has plummeted. There were just 15 unsold homes at the end of October 2014, which is the lowest October inventory in at least 10 years.
By The Numbers - San Carlos Real Estate
| Current Month | YTD Total or Average | |||
| October 2013 | October 2014 | Jan-Oct 2013 | Jan-Oct 2014 | |
| Sales | 29 | 27 | 260 | 247 |
| Days on Market | 19 | 17 | 16 | 16 |
| Months of Supply | 0.6 | 0.6 | 0.8 | 0.7 |
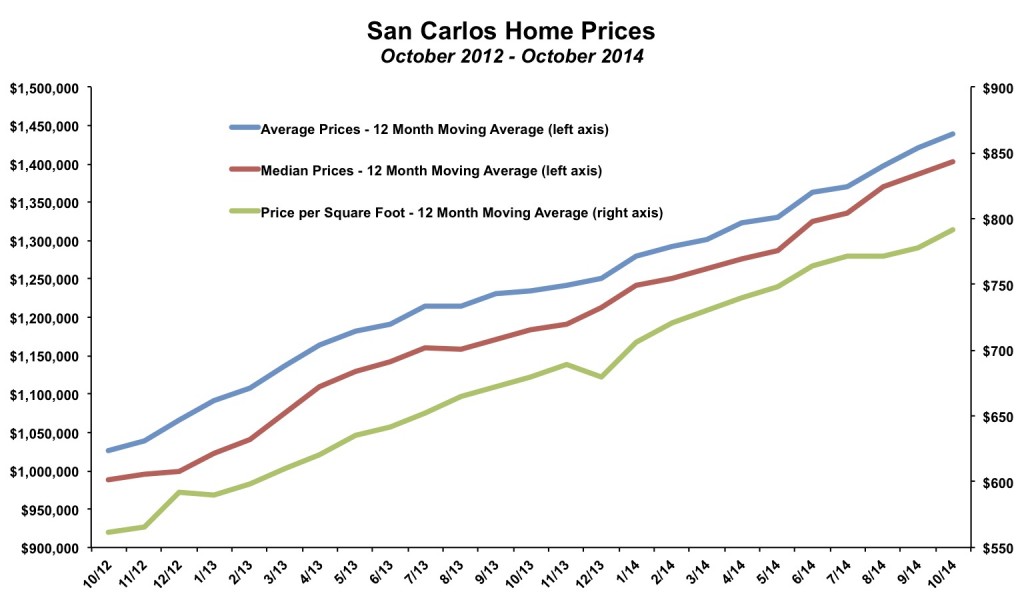
| Average Price | $1,216,000 | $1,428,000 | $1,253,177 | $1,470,733 |
| Median Price | $1,210,000 | $1,425,000 | $1,222,115 | $1,443,283 |
| Avg $ per Sq Ft | $649 | $811 | $685 | $808 |
Thinking of buying or selling a home in San Carlos?
If you're interested in learning more about the San Carlos real estate market, considering selling your home in San Carlos, or thinking about moving to San Carlos, please drop me a line and I'd love to connect with you.
This article is copyrighted by Raziel Ungar and may not be reproduced or copied without express written permission.
=


