Burlingame Real Estate - August 2013

August 2013 - Still a Great Market for Sellers
Despite a recent rise in mortgage rates it remains a great time to be a seller in Burlingame. Prices are at record levels and rising, inventory is at record lows, and most homes continue to sell quickly. Buyers can take some solace in that while the average home is still going for well above asking, there seem to be a few more homes staying on the market for an extra week and selling closer to the list price. Here are the highlights for August 2013 (comparisons are made to data going back to January 2004):- The median and average selling prices for the month were above $1.5 million for the 7th time in the last 8 months. (Note: On an annual basis neither has ever been over $1.5 million. That record will surely be broken this year)
- The average price per square foot of $729, while down compare to the prior three months was still the 8th highest monthly reading ever. It has been above $700 every month since February. (Note: On an annual basis, the previous high as $703 in 2007. That record will also surely be broken this year)
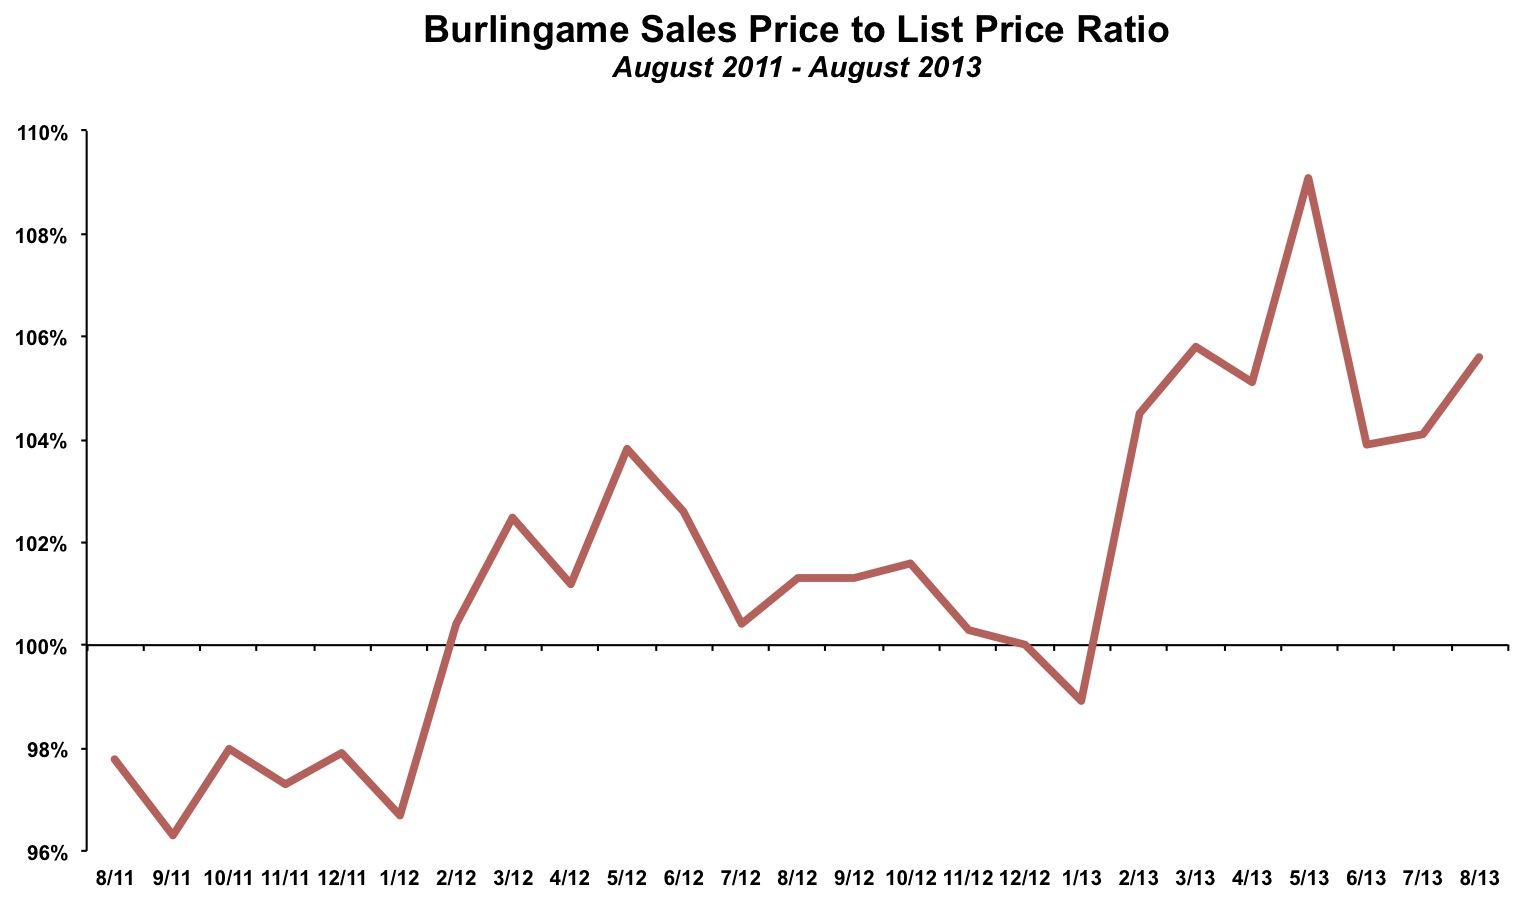
- The sales price to list price ratio was 105.6%. It has been at or above 100% in 18 of the last 19 months.
- If it seems like there are not a lot of homes coming up for sale - it's because relatively speaking there are not. 2013 is on pace for about 275 new listings, versus a range of 313 to 381 over the past ten years.
- Inventory remains low, with just 20 unsold homes at the end of August 2013.
- Despite inventory being "so low", we are still selling about the same number of homes this year as we did last year, but because of the lower days on market average, the perception is there that there are a lot less homes selling
A rough estimate of an "average" home in Burlingame is a 2,150 square foot home going for about $725 per square foot or $1.55 million.
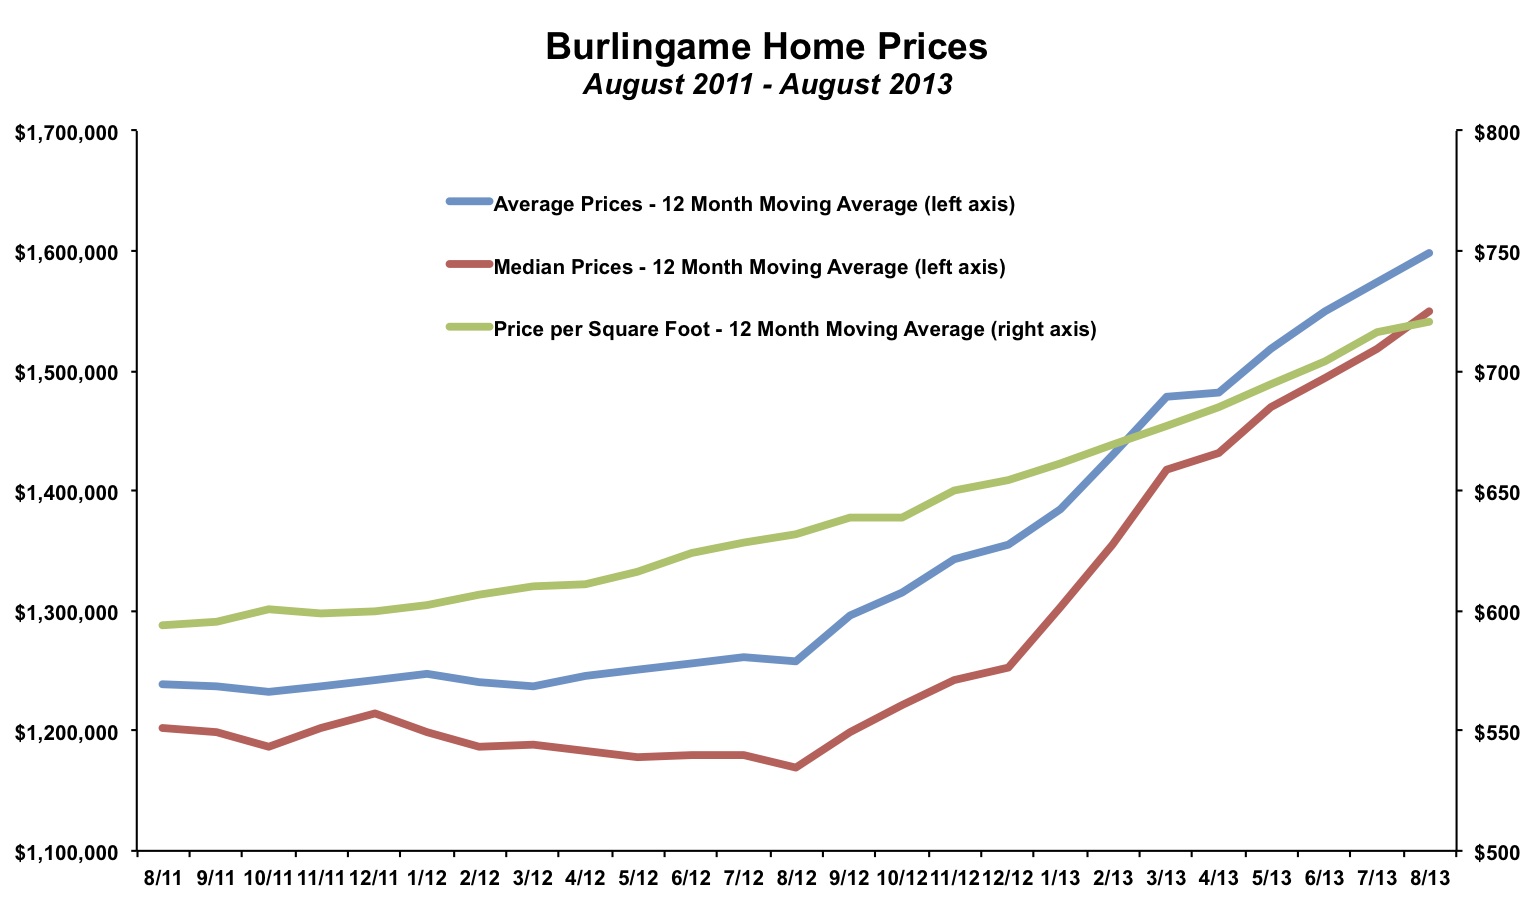
On a year-over-year basis, prices have increased by 15% to 20% Since reaching bottom in the middle of 2011, prices have risen more than 20%.
Despite some fears that rising mortgage rates might lead to a pullback in the market, we continue to see many (but not all) homes still selling for more than their asking price, even with asking prices that are set based on recent comps. The average sales price to list price ratio was once again above 100% suggesting that buyers continue to bid against each other on a regular basis. In August 2013 the ratio was 105.6%. This ratio is often a leading indicator. When it rises and stays above 100% it often signals rising prices, and vice versa when it falls it can signal flat to declining prices. Right now the indicator is signaling continued price increases.
Sales Activity Somewhat Light in August
There were 18 homes sold in Burlingame in August 2013, a bit below the 25 homes sold in August 2012 and 22 homes sold in August 2011. However, given the lack of inventory and relative dearth of new listings it was not a sign of a weakening market. In the first eight months of the year, there have been 174 homes sold, down slightly from the the 182 sales through August of 2012.
Sales are being hindered by a lack of inventory, which is a result of not enough new listings to replenish the existing level of sales. There have been only 198 new listings during the year, down from 237 listings in the same period in 2012. At the current pace, there will be around 275 listings in 2013. In the past ten years the number has fluctuated between 313 and 381.
Inventory levels are on a multi-year downward trend. We thought maybe we had seen the bottom in early 2013. Inventory was rising during the summer (as is the normal seasonal pattern). However inventory levels fell in July and then barely rose in August. The pace of new listings typically declines later in the fall, so unless there is a rush of homes put on the market in the next month or two we should expect inventory levels to remain low through at least the beginning of next year.

Recent Home Sales in Burlingame
Below is a selection of recent Burlingame real estate sales, sorted by area of Burlingame. While many homes continue to sell above the asking price, not all do. Of the 18 homes shown below, 10 sold for more than the asking price, 5 for less and 3 for equal to the final asking price. It cannot be understated the value of having a local, knowledgeable realtor working for you to help determine the best offer when buying a home. For example, the 3 bed 2 bath home on 2600 Martinez in Mills Estates went for $1.25 million, about $50,000 under the final list price. It could have just as easily gone for $50,000 over had a buyer in the market seen many other homes go over asking and assumed this one would have too. We are talking about swings of $100,000+ on a single home whether it goes for 5% above or 5% below asking, a significant sum of money!Although homes continue to sell relatively quickly compared to prior years, only a handful of the recent listings are selling in a few days. Most are one the market for at least a week. The vast majority are gone in less than three weeks. Just a few years ago, the average sold home spent closer to 6 weeks on the market.
The $1 million mark is increasingly becoming the starting point for entering the single family home market in Burlingame. The exceptions are listings that are in need of repair/updating and some smaller 2 bed/1bath type bungalow homes.

To see all of the latest Burlingame neighborhood specific market updates, click here.
By The Numbers - Burlingame Real Estate for 2013
| Current Month | YTD Total or Average | |||
| August 2012 | August 2013 | Jan - Aug 2012 | Jan - Aug 2013 | |
| Sales | 25 | 18 | 182 | 174 |
| Days on Market | 30 | 20 | 34 | 26 |
| Months of Supply | 1.6 | 1.1 | 1.7 | 0.8 |
| Average Price | $1,403,000 | $1,701,000 | $1,323,302 | $1,665,667 |
| Median Price | $1,310,000 | $1,680,000 | $1,233,440 | $1,623,247 |
| Avg $ per Sq Ft | $678 | $729 | $650 | $752 |
Thinking of buying or selling a home in Burlingame?
If you're interested in learning more about the Burlingame real estate market, considering selling your home in Burlingame, or thinking about moving to Burlingame, please drop me a line and I'd love to connect with you.
This article is copyrighted by Raziel Ungar and may not be reproduced or copied without express written permission.


