Burlingame Terrace Real Estate - February 2013

Prices Rising in Burlingame Terrace...
The Burlingame neighborhood of Burlingame Terrace typically has 1 to 2 sales per month, so getting a neighborhood specific price trend is difficult given the lack of sales. However, from the data that is available, prices do appear to be rising in tandem with the rest of Burlingame. The chart below shows 12 month moving averages for median price, average price and the average price per square foot. They are all at recent peaks.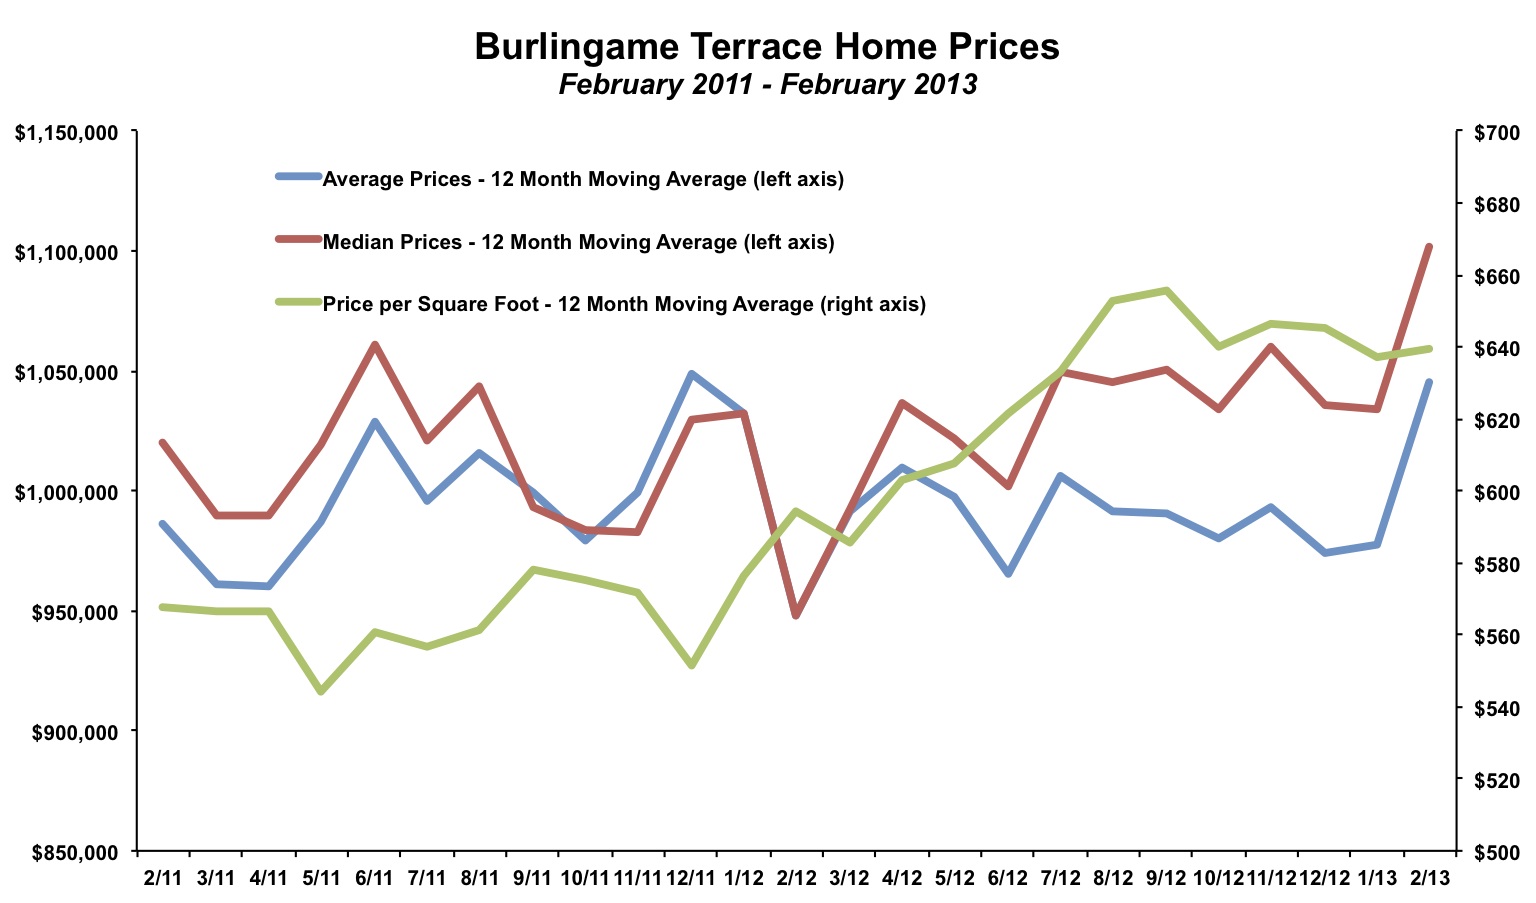
Inventory is low in Burlingame Terrace with just two homes for sale at the end of February 2013. Sellers were very successful in 2012 and in the first two months of 2013. There were 29 sales in the past 14 months, and only 6 listings have been removed or expired (for various reasons, not all of them because the seller did not receive an acceptable offer, they may have just had a change of plans). So the 'success rate' was 29 / 35, or 83%. In the prior four years, sellers were less successful, with a 'success rate' of 63%.
Burlingame Terrace 2012 Market Summary
Excerpted from the 2012 Burlingame Annual Report -Sales activity rebounded sharply in the Burlingame Terrace neighborhood in 2012. There were 28 homes sold, up from 9 sales in 2010, and even above the 21 homes sold in 2010. The average days on market was just 23 days in 2012. It was above 40 days in each of the prior three years. Over half of the homes that sold did so in less than two weeks.Home values were at their highest level in years. Median and average prices topped $1 million for the first time since 2008. The average price per square foot also increased. In 2011, the highest sale occurred at $652 per square foot. In 2012, over half of the homes sold in the neighborhood went for more than $652, including a handful above $800. While the price per square foot in Burlingame Terrace is similar to the city average, the average sale price is lower as homes in the neighborhood are typically smaller.
By The Numbers - Burlingame Terrace Real Estate for 2013
| Current Month | YTD Total or Average | |||
| February 2012 | February 2013 | Jan - Feb 2012 | Jan - Feb 2013 | |
| Sales | 1 | 1 | 3 | 1 |
| Days on Market | 12 | 67 | 8 | 67 |
| Average Price | $852,000 | $1,530,000 | $905,333 | $1,530,000 |
| Median Price | $852,000 | $1,530,000 | $984,000 | $1,530,000 |
| Avg $ per Sq Ft | $546 | $569 | $665 | $569 |
Thinking of buying or selling a home in Burlingame Terrace?
If you're interested in learning more about the Burlingame Terrace real estate market, considering selling your home in Burlingame Terrace, or thinking about moving to Burlingame Terrace, please drop me a line and I'd love to connect with you.
This article is copyrighted by Raziel Ungar and may not be reproduced or copied without express written permission.


