Easton Addition Real Estate - February 2013
Prices Up Sharply
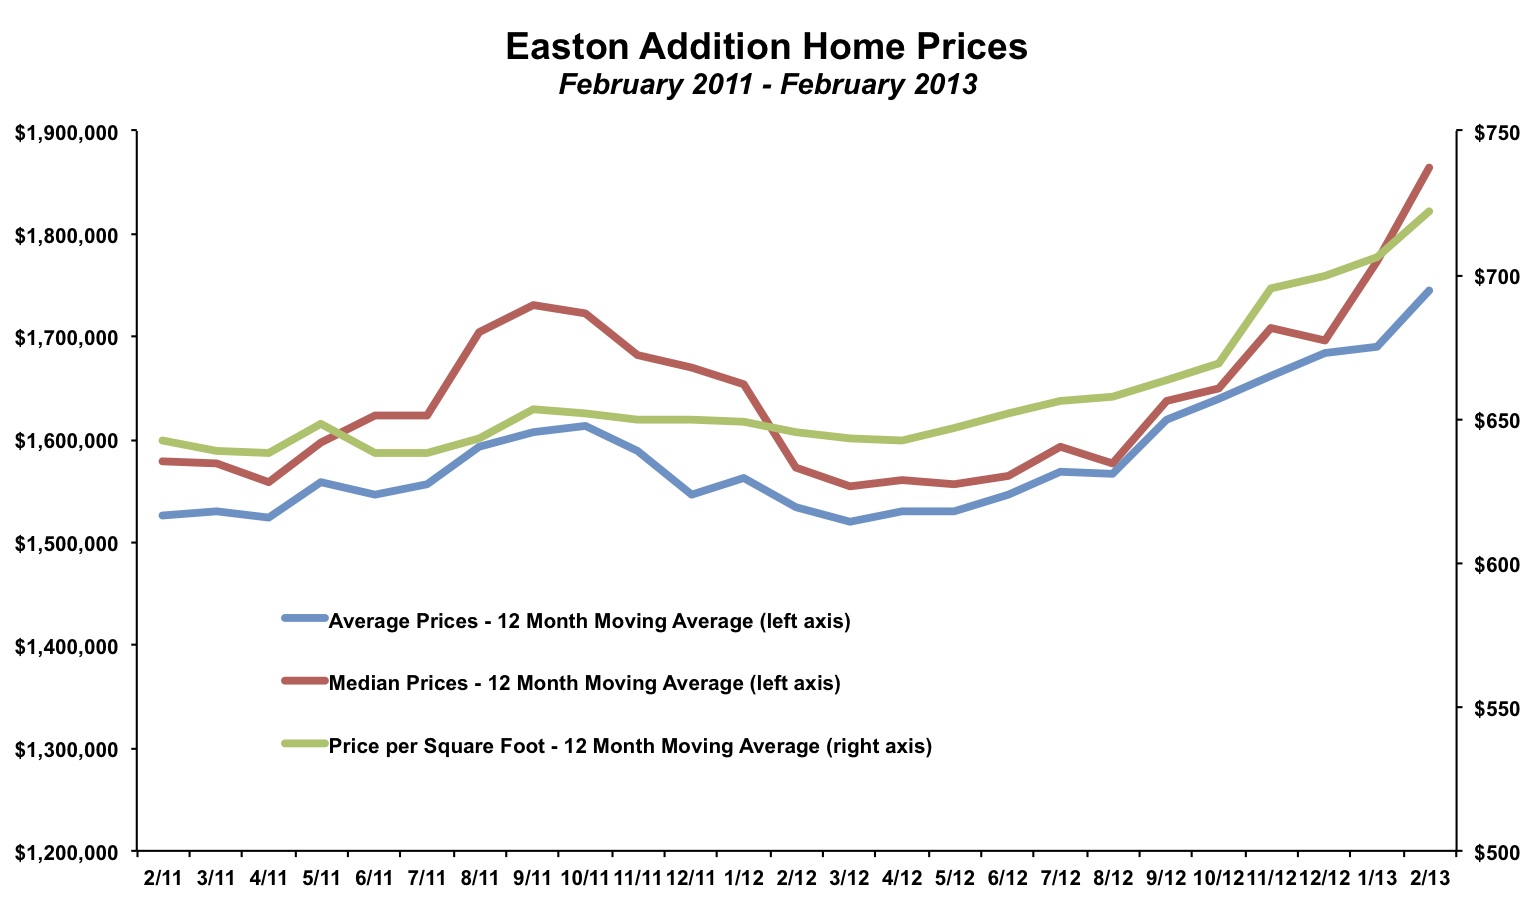
Prices are rising in the Easton Addition, one of the most prestigious neighborhoods in Burlingame. The chart below shows the 12 month moving average selling values for average prices, median prices and average price per square foot. There has been a steady increase since the middle of 2012. On a year-over-year basis, prices are up 10% to 15%. Buyers looking in the Easton Addition neighborhood will not have much choice. At the end of February 2012, there were only 8 unsold homes to choose from; at the end of February 2013, there was just one unsold home on the market.There were four homes sold in Easton Addition in February 2013. Three of the homes sold for more than $800 per square foot, well above the average of $700 per square feet that was the average in Easton Addition in 2012.
Easton Addition 2012 Market Summary
Excerpted from our 2012 Burlingame Annual Report -About one out of every four homes sold in Burlingame is located in Easton Addition, the largest neighborhood in the city. Home prices increased about 10% in 2012, erasing all of the decrease in values since 2008 (though individual experience will vary). The average price per square foot was above $700 in 2012, pushing up average sales prices to well over $1.7 million. Sub $1 million sales are increasingly rare in Easton Addition. In 2011, there were five such home homes, and in 2012, only three of the 71 homes sold for sub $1 million. Even finding homes for less than $1.25 million is becoming difficult. Only about one out of ten sales in the neighborhood in 2012 went below that figure.Inventory tightened up at the end of 2012, beyond the normal seasonal variation. At the end of the year, there were only three unsold homes on the market, compared to eight homes at the end of 2011. Low inventory means buyers must act quickly, or risk missing out on a home. The average days on market in 2012 was 33 days, about three weeks faster than 2011.
By The Numbers - Easton Addition Real Estate for 2013
| Current Month | YTD Total or Average | |||
| February 2012 | February 2013 | Jan - Feb 2012 | Jan - Feb 2013 | |
| Sales | 4 | 4 | 7 | 6 |
| Days on Market | 57 | 51 | 50 | 52 |
| Average Price | $1,246,000 | $1,889,000 | $1,451,714 | $1,860,667 |
| Median Price | $1,350,000 | $2,430,000 | $1,414,286 | $2,428,000 |
| Avg $ per Sq Ft | $654 | $843 | $648 | $801 |
Thinking of buying or selling a home in Easton Addition?
If you're interested in learning more about the Easton Addition real estate market, considering selling your home in Easton Addition, or thinking about moving to Easton Addition, please drop me a line and I'd love to connect with you.
This article is copyrighted by Raziel Ungar and may not be reproduced or copied without express written permission.

