Burlingame Real Estate - January 2014

2013 - A Record Setting Year
January 2014 - A Characteristically Slow Start to the Year
2013 was a record setting in year in Burlingame, with prices rising to new highs, inventory falling to new lows, homes selling in rapid fashion, and many homes selling for well above the asking price. But now 2013 has come to an end, and we look forward to what 2014 has in store for the Burlingame real estate market. There were just seven single family homes sold in Burlingame in January 2014, so not a lot of additional insights to draw upon in the new year. Market activity is always low at the end and beginning of the year and seven sales in a month is not atypical. Here are the highlights for January 2014 (comparisons are made to data going back to January 2004):- Just seven homes sold, but that is actually about average for a January in Burlingame
- The average sales price was $1,806,000, only the second month above $1.8 million ever
- Inventory levels remain low with just 10 unsold homes at the end of the month
- The average sales price to list price ratio dipped just below 100% (it was 99.7%) for the first time since last January
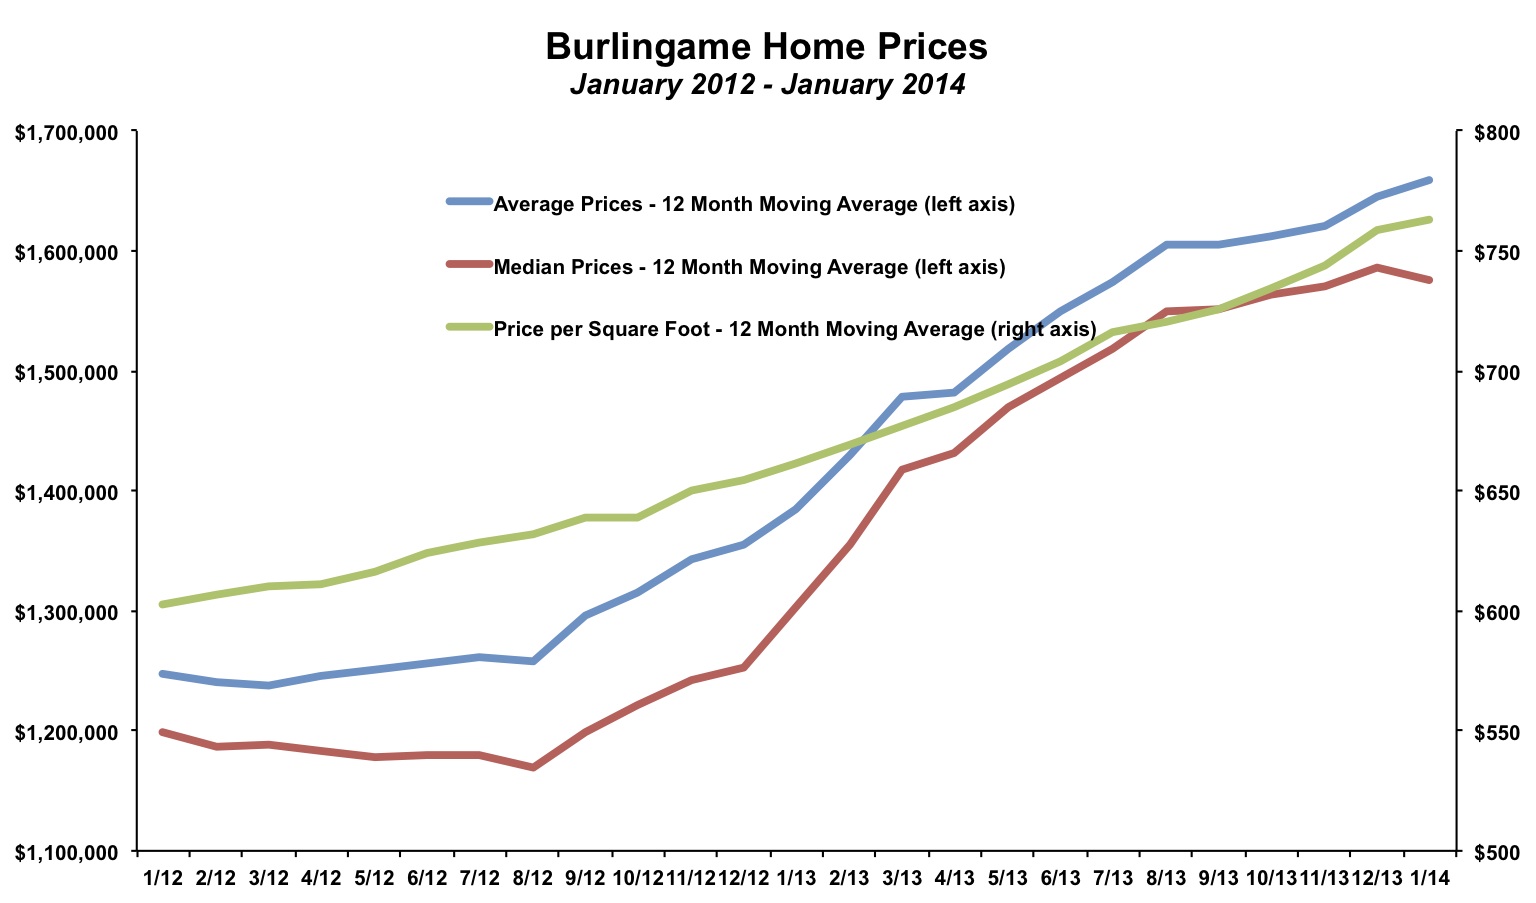
On a year-over-year basis, prices have increased by 15% to 20%. Since reaching bottom in the middle of 2011, prices have risen by 25% to 30%.
The ratio of sales price to list price is one indicator of market demand. In most areas, when the ratio is greater than 100% it is a sign that there are bidding wars and prices are rising. When the ratio is below 100%, sellers are having to cut prices to make the sale. In Burlingame, the ratio has been above 100% for most of the past two years. From February 2013 through December 2013 the ratio never went below 103.9% in any single month. However, in January 2014, the ratio was 99.7%. Buyers and sellers should watch this figure closely. Assuming sellers price their listings based on recent comps, a ratio below 100% can signal an end to rising prices. A few caveats are in order. 99.7% is really close to 100%, so it isn't like a free-fall. It is based on just one month of data where seven homes sold. Lastly and most importantly, the last time the ratio dipped below 100% was in January 2013. It only lasted one month and 2013 went on to see prices rise by 15% to 20%. With that said, this indicator will likely be a leading signal if prices slow their upward ascent. But it will take a few more months (with more sales) to mean something more than a curious random fluctuation.
Bidding wars in 2013 meant that homes sold for 5% more than their list price on average. It was the highest ratio in at least 10 years.

Not Many Sales in January (As Expected)
The winter months are typically the slowest in Burlingame. There were 7 homes sold in Burlingame in January 2014, compared to 10 homes sold in January 2013. There were 256 homes sold in 2013, down from 271 homes sold in 2012, but still more than any year from 2007-2011.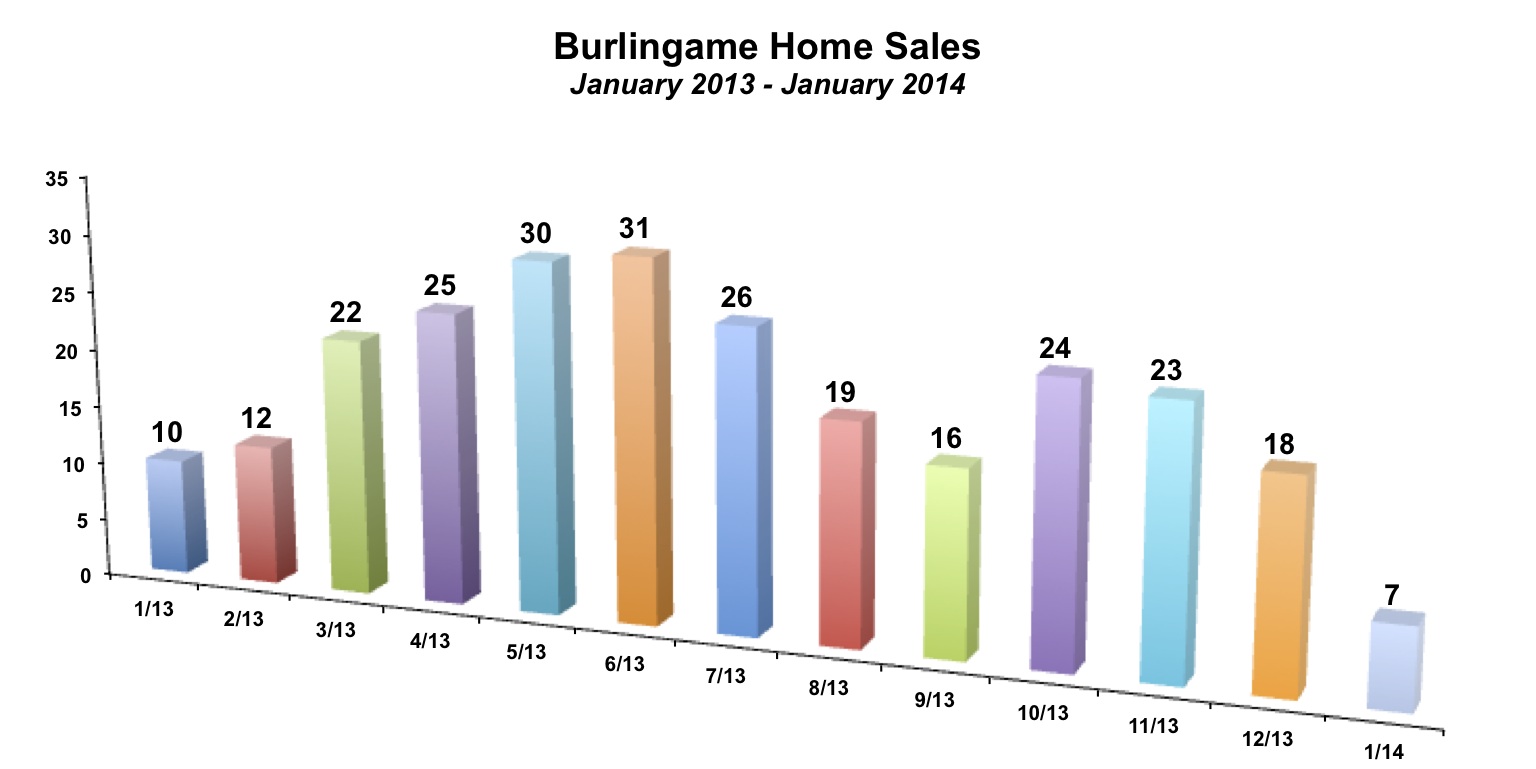
Sales are being held back by the lack of available inventory. 2013 ended with just 5 unsold homes, a record low level in Burlingame! It was the first time in at least 10 years that there were fewer than 10 homes for sale at the end of a month. Inventory levels ticked up slightly in January to 10 unsold homes. Still, this is the 2nd lowest inventory level in at least ten years. The number of newly listed homes usually starts noticeably rising in March/April with inventory peaking in July/August. If inventory levels remain low, it will put upward pressure on home prices.

Recent Home Sales in Burlingame
Below is a selection of recent Burlingame real estate sales, sorted by area of Burlingame. With just 7 sales it is hard to draw any meaningful trends.Most homes continue to sell relatively quickly, though marketing times can get stretched out over the holidays, which may have contributed to three of the homes remaining on the market for longer than a month.
The 2 bed, 1 bath home on Morrell Avenue went for just under $1 million. It is increasingly true that the only sub-$1 million single family properties in Burlingame as 2 bed, 1 bath bungalow type properties. With average price per square feet often above $800 for these smaller floorplan homes, once you get to 1,200 or 1,300 square feet the price usually goes above $1 million.

To see all of the latest Burlingame neighborhood specific market updates, [click here](https://burlingameproperties.com/communities/burlingame).
By The Numbers - Burlingame Real Estate for 2013
| Current Month | YTD Total or Average | |||
| January 2013 | January 2014 | 2012 | 2013 | |
| Sales | 10 | 7 | 271 | 256 |
| Days on Market | 40 | 24 | 33 | 23 |
| Months of Supply | 1.4 | 1.4 | 1.6 | 0.8 |
| Average Price | $1,631,000 | $1,806,000 | $1,373,815 | $1,652,008 |
| Median Price | $1,665,000 | $1,538,000 | $1,288,325 | $1,590,078 |
| Avg $ per Sq Ft | $669 | $741 | $657 | $766 |
Thinking of buying or selling a home in Burlingame?
If you're interested in learning more about the Burlingame real estate market, considering selling your home in Burlingame, or thinking about moving to Burlingame, please drop me a line and I'd love to connect with you.
This article is copyrighted by Raziel Ungar and may not be reproduced or copied without express written permission.