Burlingame Real Estate - September 2013
September 2013 - Still a Favorable Market for Sellers
Debts ceilings, government shutdowns, and rising mortgage rates - however real estate remains local and the Burlingame real estate market continues to favor sellers. Prices are at record levels and rising, inventory is at record lows, and most homes continue to sell quickly. Here are the highlights for September 2013 (comparisons are made to data going back to January 2004):- The average price per square foot of $754, was the 5th highest monthly recording ever in Burlingame, but it is the new normal for the area. The year-to-date average is $752 per square foot.
- The sales price to list price ratio was 104.1%. It has been at or above 100% in 19 of the last 20 months.
- Most homes continue to sell quickly; the average home sold in 19 days in September 2013.
- Inventory remains low, with just 22 unsold homes at the end of September 2013.
On a year-over-year basis, prices have increased by 15% to 20%. Since reaching bottom in the middle of 2011, prices have risen more than 20%.
On average, homes continue to sell for more than their asking, though many homes are going at or even below the final list price as sellers price based on rising comps. (See our review of recent home sales for more detail).
The average sales price to list price ratio has been above 100% for most of the past year-and-a-half. The ratio is often a leading indicator. When it rises and stays above 100% it signals rising prices, and vice versa when it falls it can signal flat to declining prices. Right now, the indicator is pointing to continued firm prices, but we will watch it closely.
Sales Activity Modestly Steady in September
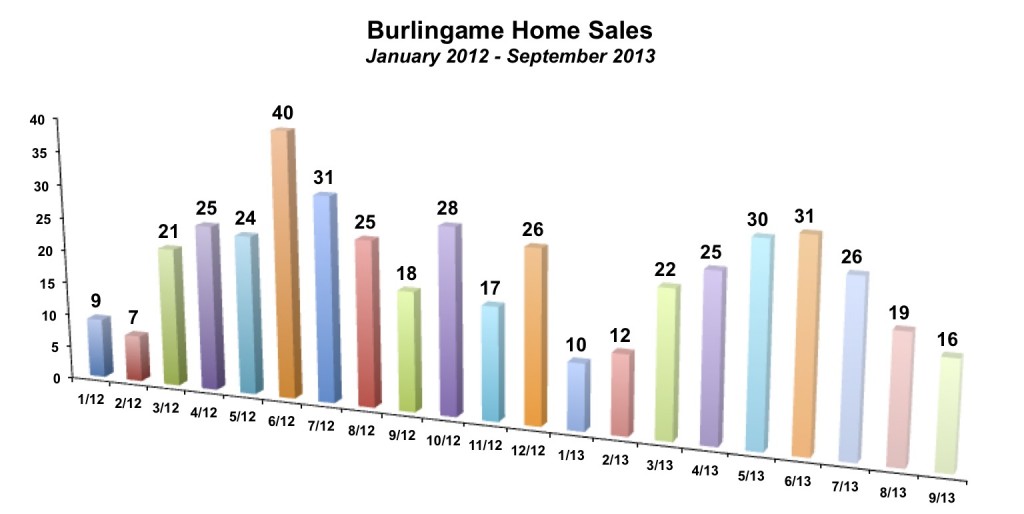
There were 16 homes sold in Burlingame in September 2013, a bit below the 18 homes sold in September 2012 and 20 homes sold in September 2011. In the first nine months of the year, there have been 191 homes sold, down slightly from the the 200 sales through the same period in 2012. At the very least, 2013 should see more sales than any year from 2007 to 2011.Interestingly, while sales are down just 5% year-over-year, it probably feels like there has been less activity. The reason is that the average days on market in 2013 has been 25.5 days, while in the first nine months of 2012 it was 32.1 days. Multiplying days by sales gives about 4,900 total days in 2013 and over 6,400 days in 2012, a difference of close to 25%. For buyers in the market, they probably feel like there is 25% less "home".
It seems somewhat ironic, but just as buyers have rushed to the market in the past year or so, the number of sellers has fallen. There have been only 227 homes listed for sale in Burlingame this year. There is a strong seasonal pattern to listings as fewer people decide to sell during the Holidays. It is very likely that there will be fewer than 300 listings in Burlingame in 2013 for the first time in at least a decade.
The lack of inventory, which is a result of not enough new listings, is hindering sales. At the end of September 2013, there were just 22 homes on the market, as compared to 43 homes for sale at the end of September 2012.
Recent Home Sales in Burlingame
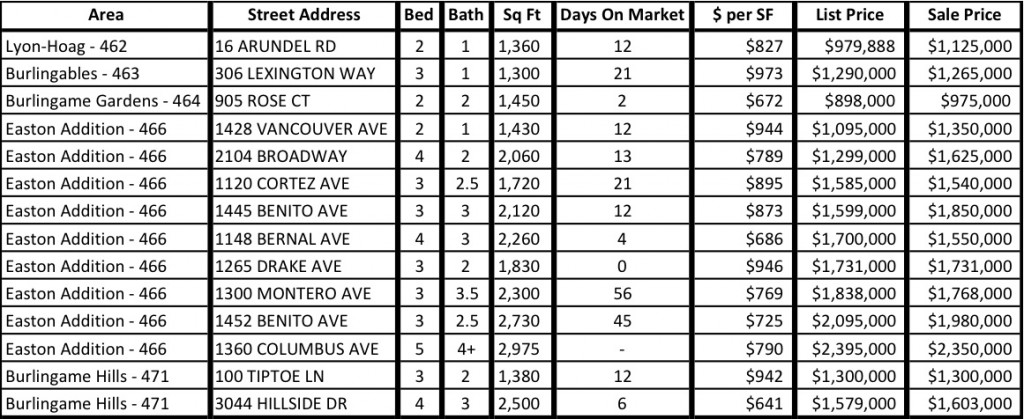
Below is a selection of recent Burlingame real estate sales, sorted by area of Burlingame. These 14 sales really show what an unpredictable market it continues to be out there. On one hand, there may be some signs of cooling. Six of the homes went for less than the final asking price and two sold at the asking price. In prior months we were seeing a majority of homes going above the asking price. However, there were still six homes that went above asking. And boy did they go over asking! Three of them in Easton Addition went for more than $250,000 over the asking price. Adding up the total above asking for home that went above the list price and subtracting the amount below asking for those that went for less than the list price still leaves a highly positive number. In summary, buyers are in total bidding above asking prices, even though some individual homes are being sold for less than the list price.Most homes continue to sell quickly in less than two weeks, though we are not seeing as many sell in less than a week.
Once again, there was just a single home that sold for less $1 million. A 2 bed, 2 bath home on Rose Court in Burlingame Gardens sold for $975,000. At the current rate, it seems likely that there will be a month soon when not one single family home is sold for less a $1 million in Burlingame.
To see all of the latest Burlingame neighborhood specific market updates, [click here](https://burlingameproperties.com/communities/burlingame).
By The Numbers - Burlingame Real Estate for 2013
| Current Month | YTD Total or Average | |||
| September 2012 | September 2013 | Jan - Sep 2012 | Jan - Sep 2013 | |
| Sales | 18 | 16 | 200 | 191 |
| Days on Market | 17 | 19 | 32 | 26 |
| Months of Supply | 2.4 | 1.4 | 1.7 | 0.9 |
| Average Price | $1,516,000 | $1,533,000 | $1,340,645 | $1,661,403 |
| Median Price | $1,370,000 | $1,395,000 | $1,245,730 | $1,604,424 |
| Avg $ per Sq Ft | $694 | $754 | $654 | $752 |
Thinking of buying or selling a home in Burlingame?
If you're interested in learning more about the Burlingame real estate market, considering selling your home in Burlingame, or thinking about moving to Burlingame, please drop me a line and I'd love to connect with you.
This article is copyrighted by Raziel Ungar and may not be reproduced or copied without express written permission.


