Belmont Real Estate - September 2013
Prices Way Up in Belmont
It was a record setting month in Belmont. Prices are rising and buyers continue to get into bidding wars. Here are some highlights for the Belmont real estate market as of September 2013:- The average price of a home in Belmont in September 2013 was $1,225,000. The median price was $1,229,000. This may be the first time over $1.2 million (at least since the mid-2000s).
- Sellers have been incredibly successful. Only 13 listings have expired or were cancelled, a proxy for listings that did not end up selling. Last year, there were 56 expired/cancelled listings and as recently as 2010 there were over 100 such listings.
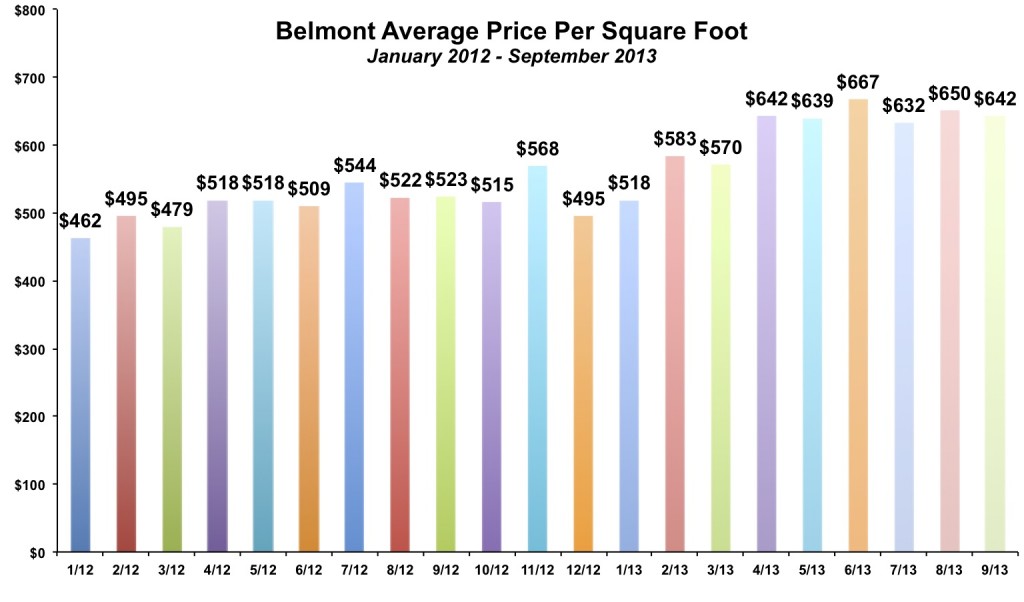
- The average price per square foot was $642 in September 2013. This was the sixth straight month above $630. The annual record is $592 in 2007, which will surely be broken this year.
- Something to watch: inventory jumped at the end of September 2013 to 24 homes. This is the highest since last September, but still very low for the area. We'll continue to see if this might be a sign of more inventory, or a one month blip.
Prices have been rising since the middle of 2012. Over the past 18 months they have increased by about 25% in Belmont, with most of those gains occurring in the past 9 months.
Buyers continue to compete in multiple offers in Belmont. While not all homes sell for more than the asking price, the average home has sold for 9% over asking! In September, the ratio of sales price to list price was 106.5%.
Home sales are up slightly this year, with 195 sales through the first nine months of the year, as compared to 186 sales through the first nine months of 2012. Most areas of San Mateo County have actually seen a slight drop in home sales compared to 2012.
Inventory levels have been at or near record lows in Belmont for most of the year. The average monthly ending number of unsold homes has been just 16. Last year it was 27 homes and in the year prior it was 40 homes. Buyers have fewer options from which to choose, which consequently is a big driver of homes being so competitive. Inventory levels jumped to 24 unsold homes at the end of September 2013. That is the highest level since last September. Rising inventory is often one of the first signs of a market slowdown. While it is still much too early to jump to any conclusions, it is something to watch. (As an example of why one month does not make a trend, inventory levels increased by more than 60% in San Carlos from June 2013 to July 2013. By September 2013 they had fallen by more than 50%!)
By The Numbers - Belmont Real Estate for 2013
| Current Month | YTD Total or Average | |||
| September 2012 | September 2013 | Jan - Sep 2012 | Jan - Sep 2013 | |
| Sales | 19 | 19 | 186 | 195 |
| Days on Market | 28 | 26 | 31 | 20 |
| Months of Supply | 1.6 | 1.3 | 1.5 | 0.8 |
| Average Price | $892,000 | $1,225,000 | $943,435 | $1,131,964 |
| Median Price | $938,000 | $1,229,000 | $919,952 | $1,095,096 |
| Avg $ per Sq Ft | $523 | $642 | $513 | $625 |
Thinking of buying or selling a home in Belmont?
If you're interested in learning more about the Belmont real estate market, considering selling your home in Belmont, or thinking about moving to Belmont, please drop me a line and I'd love to connect with you.
This article is copyrighted by Raziel Ungar and may not be reproduced or copied without express written permission.


