May 2013 - An Impressive Month
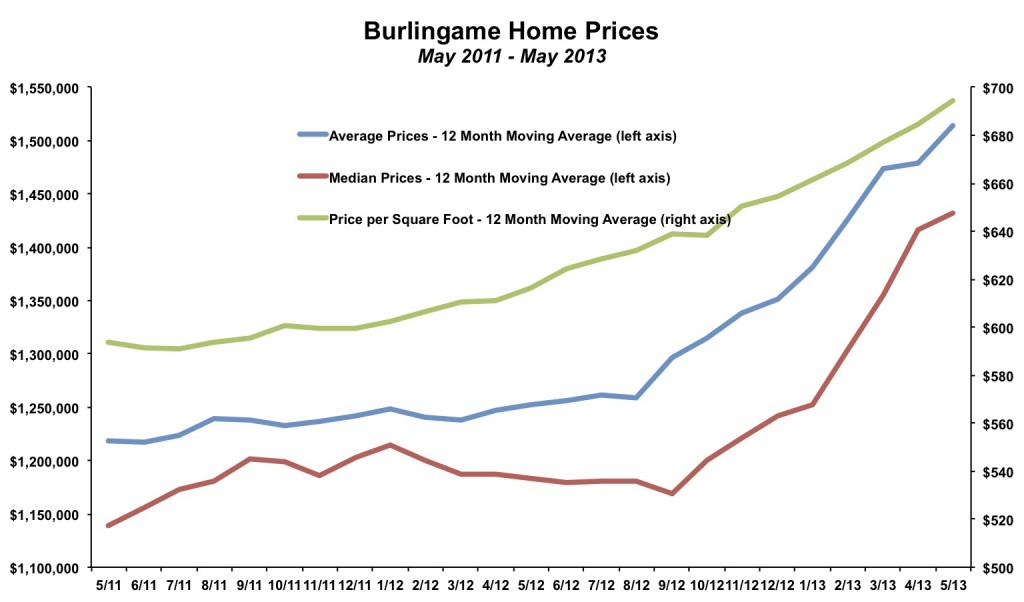
It was an impressive and perhaps even historic month for the Burlingame real estate market with records in various sales prices variables. Although one month does not define the trend, sometimes it is interesting to just look at the raw data. Here are the highlights for May 2013 (comparisons are made to data going back to January 2004)- The average selling price of $1,811,000 was the highest ever by $84,000. The previous record was $1,727,000 back in April 2008.
- The median selling price of $1,702,000 was the second highest ever, just behind the $1,744,000 recorded two months ago in March 2013.
- The average price per square foot of $781 was the highest ever. The previous record was $763 in August 2007.
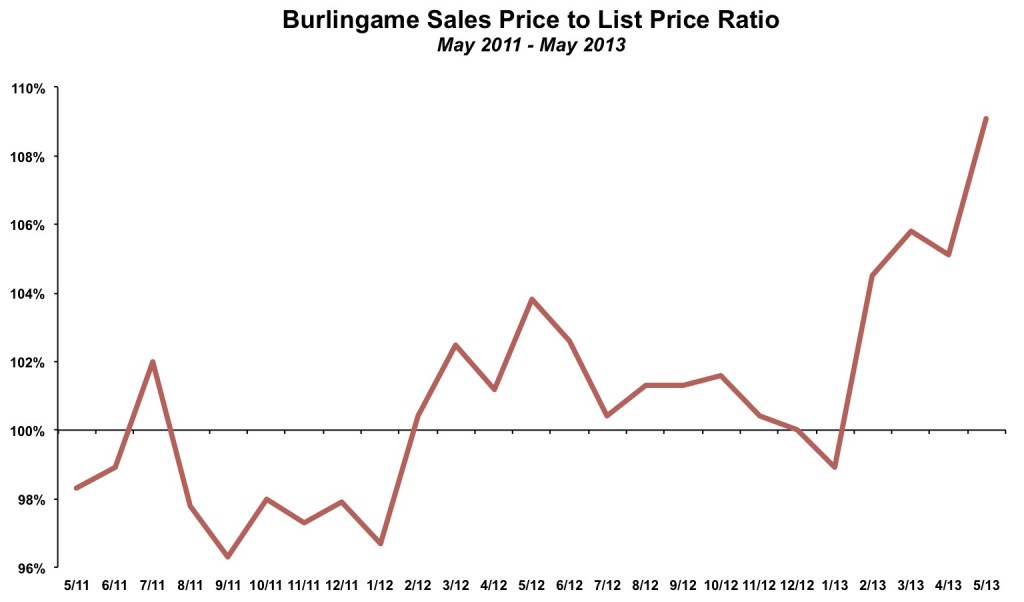
- The sales price to list price ratio was 109.1%. The previous high mark since January 2004 was 108.8% in March 2005.
- There were no listings that expired or were cancelled from the MLS. This is only the second time that has happened since January 2004. The other time was last month, April 2013! This is a sign of how strong the market is. Nearly every seller is receiving an acceptable offer.
The average sales price to list price ratio has been well above 100% for the past four months. In May 2013 it was 109.1%. While even in this market not all homes sell or even sell for more than the asking price, the average seller received about $150,000 more than their final listing price in May 2013. What this also means is that the average sold home was listed for around $710 per square foot, which is higher than the annual peak of $703 in 2007. Essentially, buyers saw list prices that approximated the previous market summit (including the absolute peak) and then outbid each other to pay 9% above that amount.
Sales Activity Healthy Again in May
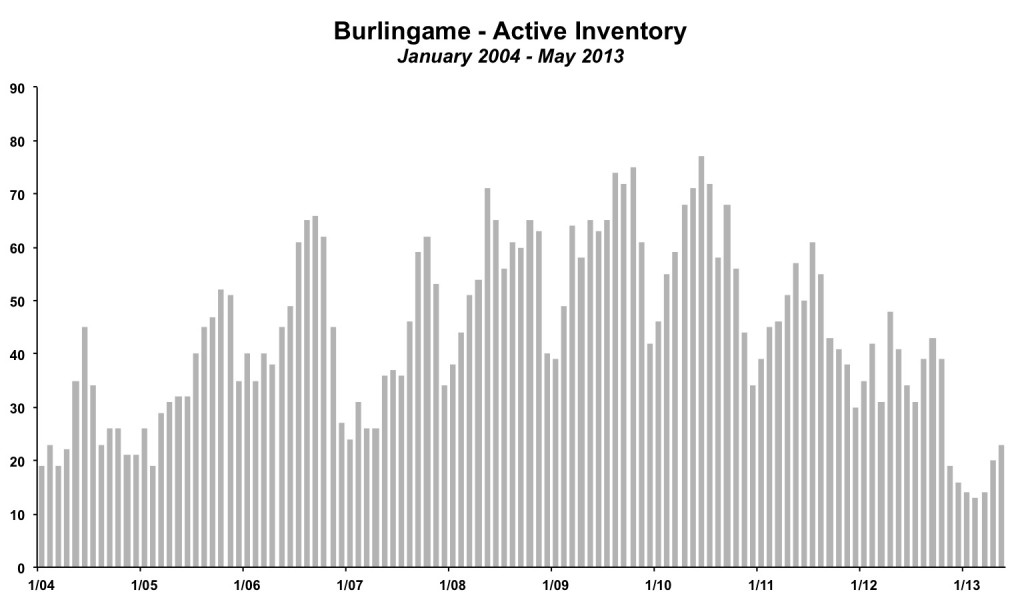
There were 30 homes sold in Burlingame in May 2013. In the first five months of the year, there have been 99 homes sold, as compared to 86 sales in the first five months of 2012. Impressively, sales activity is up 15%, at the same time that the number of newly listed homes is down 16%.Inventory increased slightly in March to 23 unsold homes at the end of the month, but still remains near historically low levels. Inventory levels normally increase as we approach the summer months as more sellers list their homes. If there is a sustained increase in available inventory it would be a sign that buyer demand is diminishing and could point to a slowdown in rising home prices. The market is not at that point yet. The months of supply, which takes into account the current rate of sales, is at 0.8 months. There were 1.7 months of supply last May.
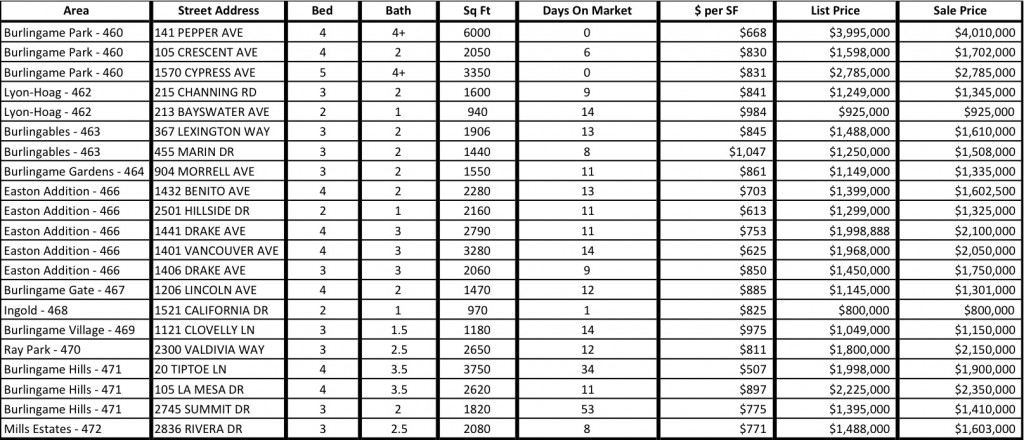
Recent Home Sales in Burlingame
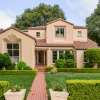
Below is a selection of recent Burlingame real estate sales, sorted by area of Burlingame. As you can see, most homes continue to sell above the asking price; of the 21 homes shown below, 17 sold for more than the asking price and 3 sold for equal to the final asking price. Only one listing went for less than the asking price.To get an idea of how much prices have risen, consider that of the 21 homes below, 13 sold for more than $800 per square foot. In all of 2012, there were 24 homes that sold for more than $800 per square foot and the average price per square foot for the entire year was just under $660.
Homes continue to sell extremely fast. The vast majority of homes that end up selling are gone in less than two weeks, and many are on the market for only a handful of days.
To see all of the latest Burlingame neighborhood specific market updates, click here.
| Current Month | YTD Total or Average | |||
| May 2012 | May 2013 | Jan - May 2012 | Jan - May 2013 | |
| Sales | 24 | 30 | 86 | 99 |
| Days on Market | 39 | 32 | 34 | 30 |
| Months of Supply | 1.7 | 0.8 | 2.3 | 0.9 |
| Average Price | $1,387,000 | $1,811,000 | $1,278,442 | $1,645,626 |
| Median Price | $1,249,000 | $1,702,000 | $1,156,233 | $1,628,818 |
| Avg $ per Sq Ft | $663 | $781 | $635 | $736 |
Thinking of buying or selling a home in Burlingame?
If you're interested in learning more about the Burlingame real estate market, considering selling your home in Burlingame, or thinking about moving to Burlingame, please drop me a line and I'd love to connect with you.
This article is copyrighted by Raziel Ungar and may not be reproduced or copied without express written permission.

