Burlingame Real Estate - January 2014
February 2014 - Mixed Signals to Start the Year, Not Enough Sales to Draw Strong Conclusions
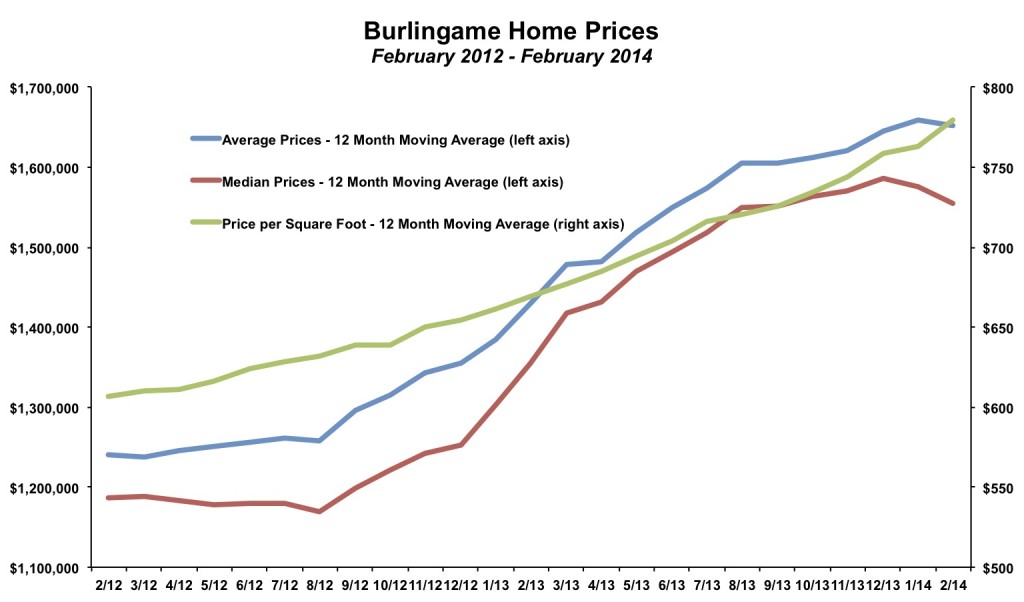
With just 12 sales in the first two months of the year, it is hard to draw any definite conclusions on what is going in the Burlingame real estate market. Will the sellers market continue or is there a shift to a more neutral market between buyers and sellers? Data pointing towards the former is that buyers continue to pay record prices per square foot and the big picture has not changed (local economy is still strong, mortgage rates are still low, Burlingame is still a desirable place to live). Some signs of a move to a more neutral market are low sales activity (though perhaps driven by a lack of inventory at the end of 2013), rising inventory (though not outside of normal seasonal patterns) and a lower sales price to list price ratio (though still averaging above 100% for the year).At this point, there is not enough information to point to a change in the Burlingame real estate market. It still favors sellers. March and April will hopefully provide clearer signals.
Here are the highlights for February 2014 (comparisons are made to data going back to January 2004):
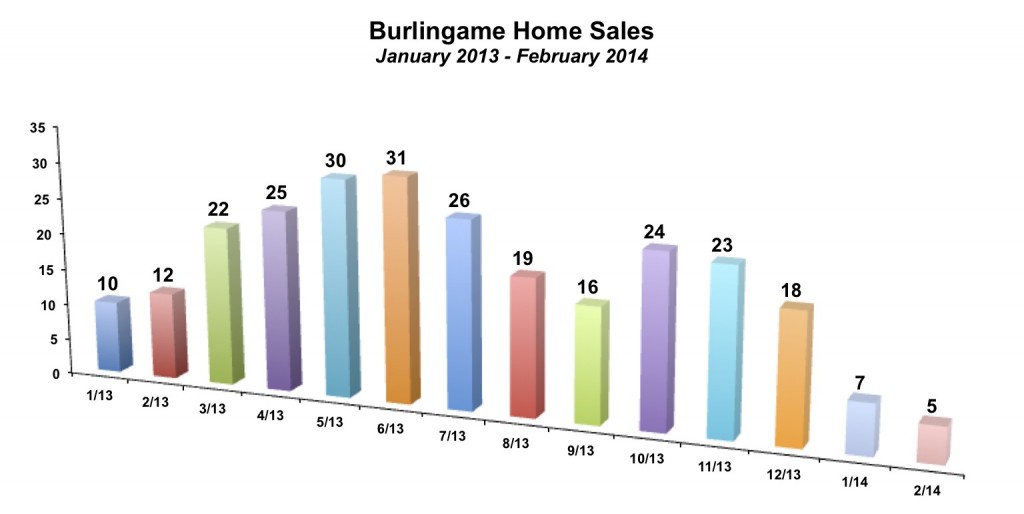
- Just five homes sold...the fewest in any month in the past ten years (though less than 10 sales is not abnormal for February)
- The average price per square foot was $904, the first time it was above $900 in any month in Burlingame. More impressively, before November 2013, it had never even been above $800 per square foot in any month.
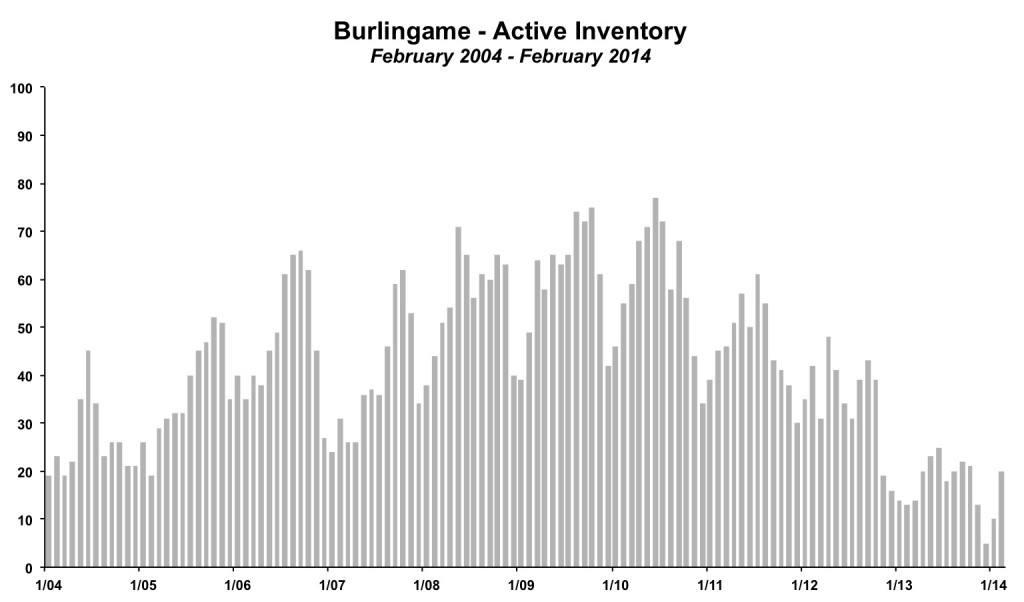
- Inventory levels remain low, but did increase again to 20 unsold homes at the end of the month.
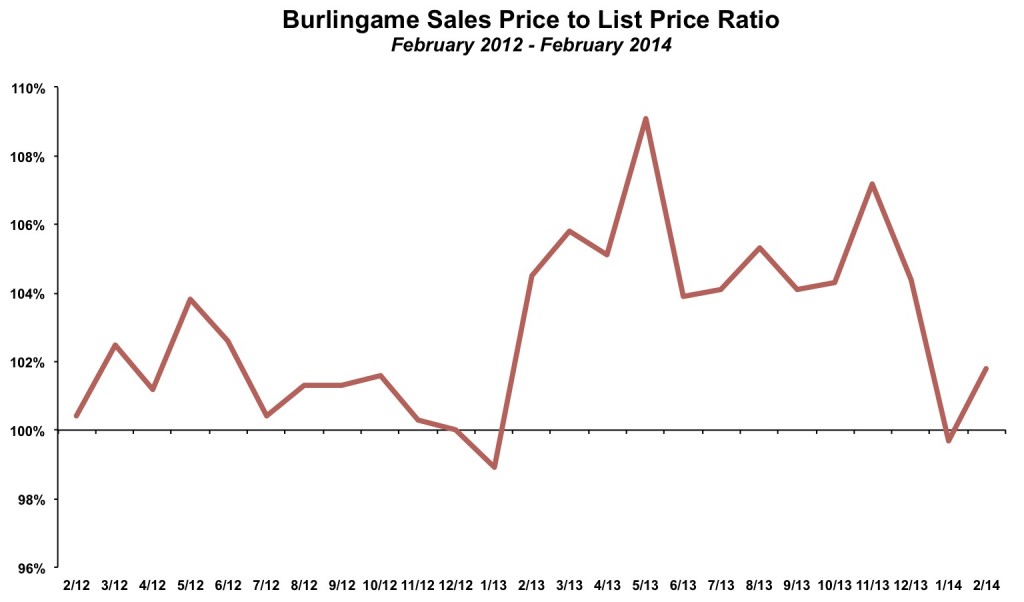
The ratio of sales price to list price is one indicator of market demand. In most areas, when the ratio is greater than 100% it is a sign that there are bidding wars and prices are rising. When the ratio is below 100%, sellers are having to cut prices to make the sale. Like any measurement, it is subject to false signals and random month-to-month fluctuation. Let's flashback to 2012. For most of the year, the ratio was above 100% and prices rose by around 10%. For the first time in years, the market favored sellers. Near the end of 2012 and beginning of 2013, the ratio dipped down and was even below 100% in one month. It was a warning signal...the marketplace momentum could be reversing. Stay on guard for the next few months. It was soon revealed to be false signal as the ratio jumped back up to well above 100% for most of 2013. Prices rose by more than 15% in 2013.
Back to the present day, the ratio of sales price to list price was below 100% in January 2014 and then above 100% in February 2014, but still below most of what was seen in most of 2014.
In Burlingame, the ratio has been above 100% for most of the past two years. From February 2013 through December 2013 the ratio never went below 103.9% in any single month. However, in January 2014, the ratio was 99.7%. Buyers and sellers should watch this figure closely. Assuming sellers price their listings based on recent comps, a ratio below 100% can signal an end to rising prices. A few caveats are in order. 99.7% is really close to 100%, so it isn't like a free-fall. It is based on just one month of data where seven homes sold. Lastly and most importantly, the last time the ratio dipped below 100% was in January 2013. It only lasted one month and 2013 went on to see prices rise by 15% to 20%. With that said, this indicator will likely be a leading signal if prices slow their upward ascent. But it will take a few more months (with more sales) to mean something more than a curious random fluctuation.
Sales Stay Low Through February
Sales are typically low to start the year in Burlingame (and most real estate markets across the country). Sales then pick up in the summer time as many families prefer to move outside of the normal school year. Still, sales have been low even after adjusting for seasonal factors. There have been just 12 homes sold in the first two months of 2014 in Burlingame, compared to 22 homes sold in the same period in 2013. In fact, this is the slowest start to the year in at least ten years. Part of the reason that sales have been so low is that inventory to start the year was also at the lowest level in more than ten years. It follows that few homes for sale leads to low sales. The number of new listings picked up near the end of the month. March will be a good barometer of the underlying demand in the Burlingame real estate market. If sales remain depressed it could be a sign that buyer interest is starting to soften.There is no doubt that at least some, if not most, of the reason that the lack of sales to start the year has been to low inventory. 2013 ended with just 5 unsold homes, a record low level in Burlingame! It was the first time in at least 10 years that there were fewer than 10 homes for sale at the end of a month. Inventory levels have since jumped to 20 unsold homes at the end of February 2014. Inventory levels have been falling steadily since mid-2010. However, the 20 unsold homes in February 2014 is actually above where the market was a year prior, when there were 12 unsold homes in February 2013. Still, inventory remains very low by historical standards.
Even the increase from 5 unsold homes in December to 20 unsold homes in February is not that large of an increase. Inventory typically rises throughout the first half of the year. As an example, in 2009, inventory did not change from the beginning of the year to the end of the year, but fluctuated during the year. 2008 ended with 40 unsold homes for sale. 2009 ended with 42 unsold homes for sale, so there was not net for the entire year. During the year, inventory rose to 75 unsold homes at one point. From December 2008 to February 2009, inventory increased from 40 unsold homes to 49 unsold homes. In March 2009, it rose to 64 unsold homes. It is not uncommon even in a timeframe where the underlying "true" inventory is not rising for inventory levels to increase by 15 or even 25 homes in the first few months of the year. Similar to the sales levels, however, this will be something to track closely. A sustained increase in inventory levels above and beyond the normal seasonal pattern would be a sign that the market, which has been clearly favoring sellers for the past few years, could be tipping somewhat back towards a more neutral sign. At this point, the market still strongly favors sellers.
Recent Home Sales in Burlingame
Below is a selection of recent Burlingame real estate sales, sorted by area of Burlingame. With just a handful of sales it is hard to draw any meaningful trends. Most homes continue to sell relatively quickly. Sub-$1 million single family properties in Burlingame are increasingly rare. There were none in the recent time period. Except for homes with serious cosmetic, structural or location issues the only type of single family homes that are regularly going for less than $1 million are the 2 bed, 1 bath bungalow type properties. Even then, if they are in a desirable location or have a lot with room to expand, the selling price will often by above $1 million.When we see homes that stay on the market for only a short period (say, less than two weeks) and sell for more than the list price it is often a sign that the winning offer had no contingencies. We recently did a review of 2013 sales and found that more than half of the home sales the winning big came in with no contingencies.
Going in with no contingencies can be a big risk for buyers, though it can be mitigated by doing thorough pre-inspections. The reward is being the winning bidder in a competitive real estate market.
To see all of the latest Burlingame neighborhood specific market updates, click here. (https://burlingameproperties.com/communities/burlingame#stats-trends)](https://burlingameproperties.com/articles/1016-burlingame-real-estate-january-2014).
By The Numbers - Burlingame Real Estate
| Current Month | YTD Total or Average | |||
| February 2013 | February 2014 | Jan-Feb 2012 | Jan-Feb 2013 | |
| Sales | 12 | 5 | 22 | 12 |
| Days on Market | 47 | 42 | 44 | 32 |
| Months of Supply | 1.1 | 4.0 | 1.2 | 2.5 |
| Average Price | $1,616,000 | $1,536,000 | $1,622,818 | $1,693,500 |
| Median Price | $1,525,000 | $1,275,000 | $1,588,636 | $1,428,417 |
| Avg $ per Sq Ft | $705 | $904 | $702 | $809 |
Thinking of buying or selling a home in Burlingame?
If you're interested in learning more about the Burlingame real estate market, considering selling your home in Burlingame, or thinking about moving to Burlingame, please drop me a line and I'd love to connect with you.
This article is copyrighted by Raziel Ungar and may not be reproduced or copied without express written permission.

