Prices Have Reached Previous Peak
Prices continue to rise in the Burlingame real estate market. It is tough to call a moment in time, but buyers in the market right now (May/June 2013) will probably on average be paying what their hypothetical counterparts paid at the previous peak in late 2007/early 2008.The chart below shows the 12 month moving average (to smooth out random month-to-month variation) of the average price, median price and average price per square foot in Burlingame. The average price per square foot by this measure is $684. This is 3% below the absolute peak of $703 in March 2008. However, these are smoothed measures, so there is some lag. In March 2008, inventory levels had nearly doubled in the past year, sales volumes were collapsing and sales prices were below list prices as buyers balked at asking prices. Values were headed downward and began to noticeably decline by the second half of the year. In the current Burlingame real estate market however, inventory has nearly fallen by half in the past year, sales volumes are high and rising, and homes are regularly selling above asking prices. Prices have been and continue to head upward. Right around the April to June 2013 timeframe is when the upward moving prices are passing the downward moving prices of early 2008.
Another way to look at the data is that the average price per square foot has been above $700 each of the past three months, averaging $719. The highest three month average for per square foot pricing was $728 in August 2007.
On a year-over-year basis, prices are up somewhere in the range of 10% to 15%. Since reaching bottom in the middle of 2011, prices have risen closer to 15% to 20%.

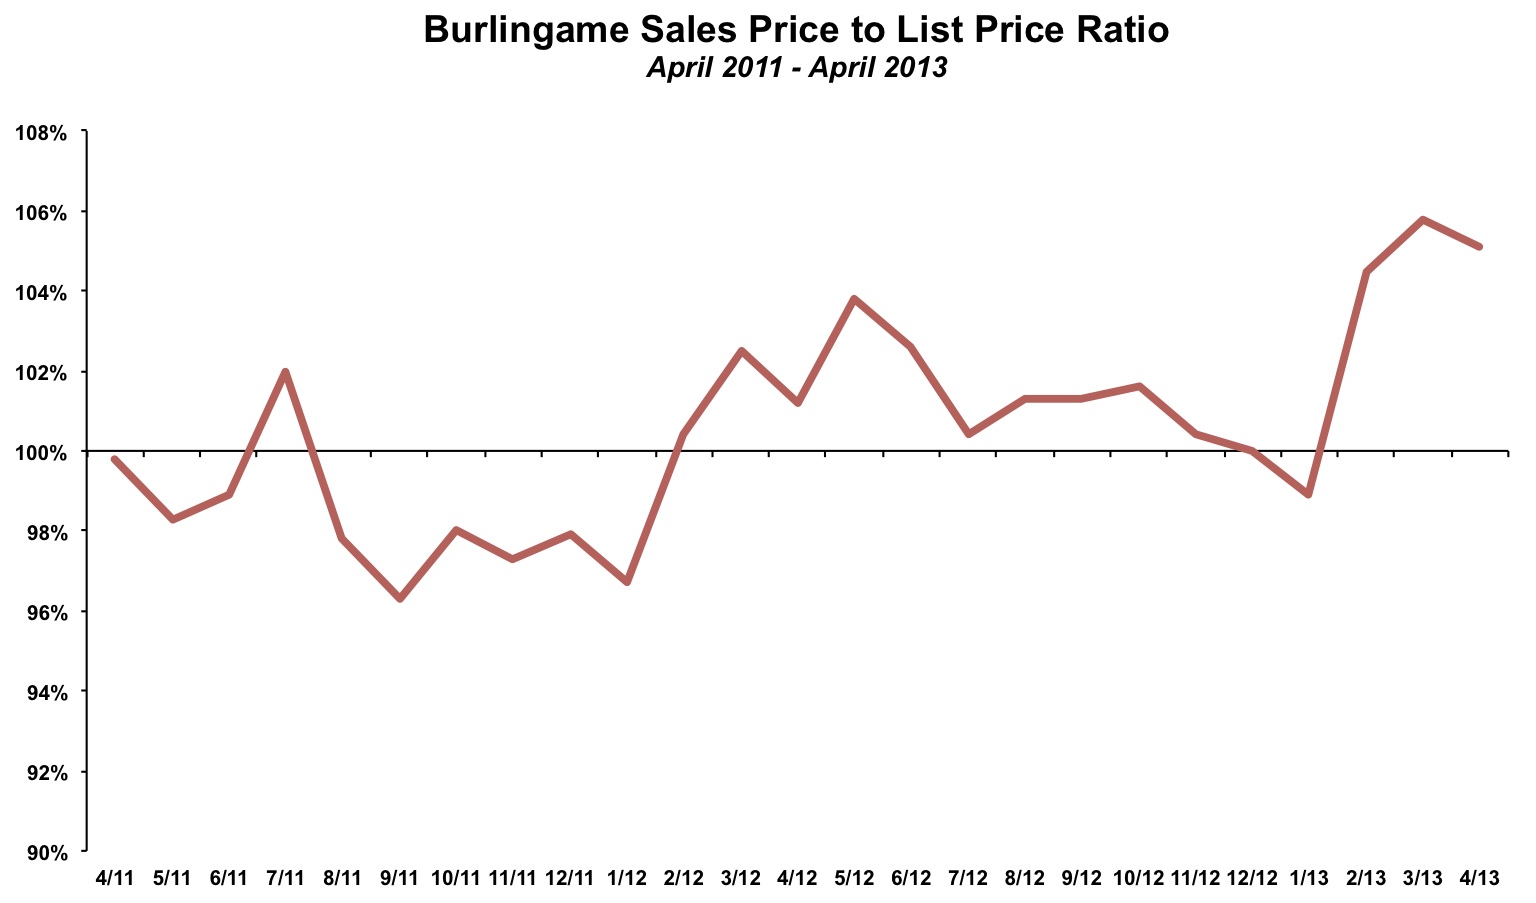
After cooling off in December and January, the average sales price to list price ratio has surged well above 100% in each of the last three months. The average sold home is now going for 5% above the final list price. While not all homes sell or even sell for more than the asking price, the average seller is getting over $70,000 than their final listing price. A ratio above 100% is a sign that buyers are regularly bidding above asking prices. It is also another sign that prices are continuing to rise. List prices are normally set based on recent comparable sales. If sale prices are above list prices this suggests that the most recent sales are going for a higher valuation than past sales. In this market, some sellers are listing above recent comps, making it even more impressive that sales continue to outpace list prices.
Sales Activity Healthy Again in March
There were 25 homes sold in Burlingame in April 2013. In the first four months of the year, there have been 69 homes sold, as compared to 62 sales in the first four months of 2012. At the current pace, Burlingame real estate could be headed to 300 annual sales for the first time since 2004, when 311 homes were sold.
Inventory increased slightly in April to 20 unsold homes at the end of the month, but still remains near historically low levels. Inventory levels normally increase as we approach the summer months as more sellers list their homes. If there is a sustained increase in inventory it would be a sign that buyer demand is diminishing and could point to an end to increase home prices. The market is not at that point yet. Inventory levels just a year ago were more than double what they are today.

Recent Home Sales in Burlingame
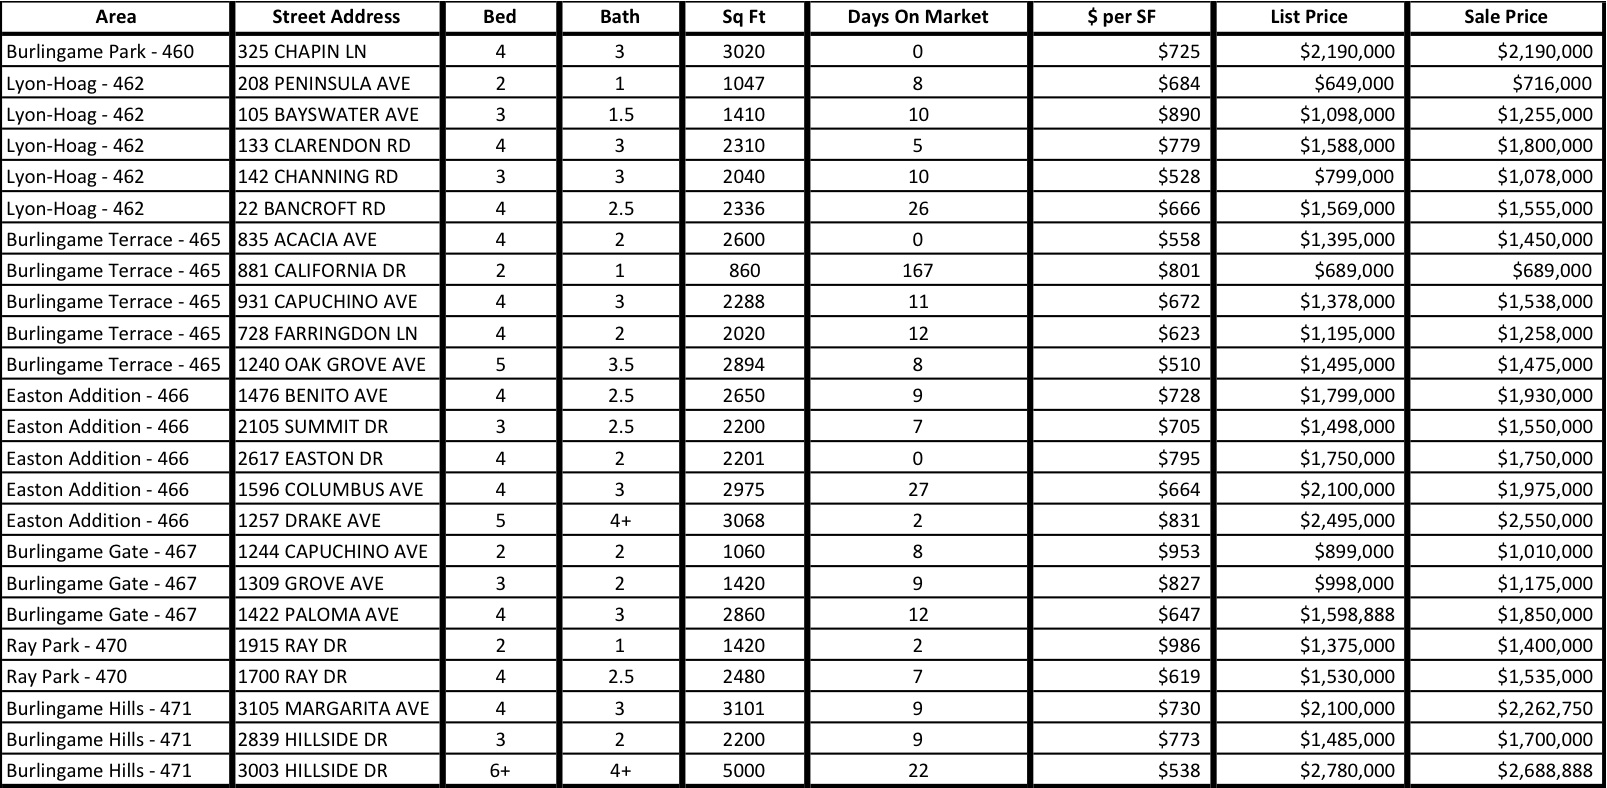
Below is a selection of recent Burlingame real estate sales, sorted by area of Burlingame. As you can see, most homes continue to sell above the asking price; of the 24 homes shown below, 16 sold for more than the asking price and 4 sold for equal to the final asking price. Only four listings went for less than the asking price.Prices have clearly risen over the past 18 months. Only four of the 24 homes sold for less than $600 per square foot. In 2011, the average home sold for just under $600 per square foot.
Homes continue to sell extremely fast. The vast majority of homes that end up selling are gone in less than two weeks, and many are on the market for only a handful of days.
To see all of the latest Burlingame neighborhood specific market updates, click here.
By The Numbers - Burlingame Real Estate for 2013
| Current Month | YTD Total or Average | |||
| April 2012 | April 2013 | Jan - Apr 2012 | Jan - Apr 2013 | |
| Sales | 25 | 25 | 62 | 69 |
| Days on Market | 23 | 24 | 32 | 30 |
| Months of Supply | 1.9 | 0.8 | 2.5 | 0.9 |
| Average Price | $1,401,000 | $1,459,000 | $1,236,419 | $1,573,725 |
| Median Price | $1,300,000 | $1,475,000 | $1,120,323 | $1,597,000 |
| Avg $ per Sq Ft | $628 | $719 | $625 | $716 |
Thinking of buying or selling a home in Burlingame?
If you're interested in learning more about the Burlingame real estate market, considering selling your home in Burlingame, or thinking about moving to Burlingame, please drop me a line and I'd love to connect with you.
This article is copyrighted by Raziel Ungar and may not be reproduced or copied without express written permission.