
April 2014 - Sellers Market Continues
It remains a sellers market in Burlingame. Prices continue to rise. Inventory remains at historically low levels. Most newly listed homes are selling in less than 20 days, and more often than not for above asking prices.Here are the highlights for April 2014 (comparisons are made to data going back to January 2004):
- The average price per square foot was $878. While "only" the third highest monthly figure ever, the two higher months were February and March.
- Eight homes sold above $1,000 per square foot versus ten such homes in all of 2013
- There were 37 homes sold. It was the second highest monthly total in the past ten years.
- Homes continue to sell quickly. The average home sold in about two weeks.
Note that median prices appear to have declined in the past few montsh and the rate of increase in average prices has slowed down. This is due solely to smaller homes happening to be listed and sold in the past few months.
Prices still continue to rise. The average price per square foot has been above $875 in each of the past three months. It was only at the end of 2013 that the monthly price per square foot ever went above $800.

The ratio of sales price to list price is one indicator of market demand. In most areas, when the ratio is greater than 100% it is a sign that there are bidding wars and prices are rising. When the ratio is below 100%, sellers are having to cut prices to make the sale. Prices have been rising for the past three years in Burlingame. Sellers have adjusted their list prices accordingly. Despite this, buyers continue to bid above asking prices. The ratio of sales price to list price in April 2014 was 109%, meaning that buyers paid on average 9% more than the final asking price.

Sales Jump Sharply in April
After a slow start to the year, sales jumped higher in April. There were 37 homes sold in the month. It was the second highest monthly total in the past ten years, behind the 40 sales in the middle of 2012. Despite the strong month, sales activity is still actually down year-over-year. Through the first four months of 2014 there have been 67 homes sold, down slightly from the 69 homes in the same period in 2013.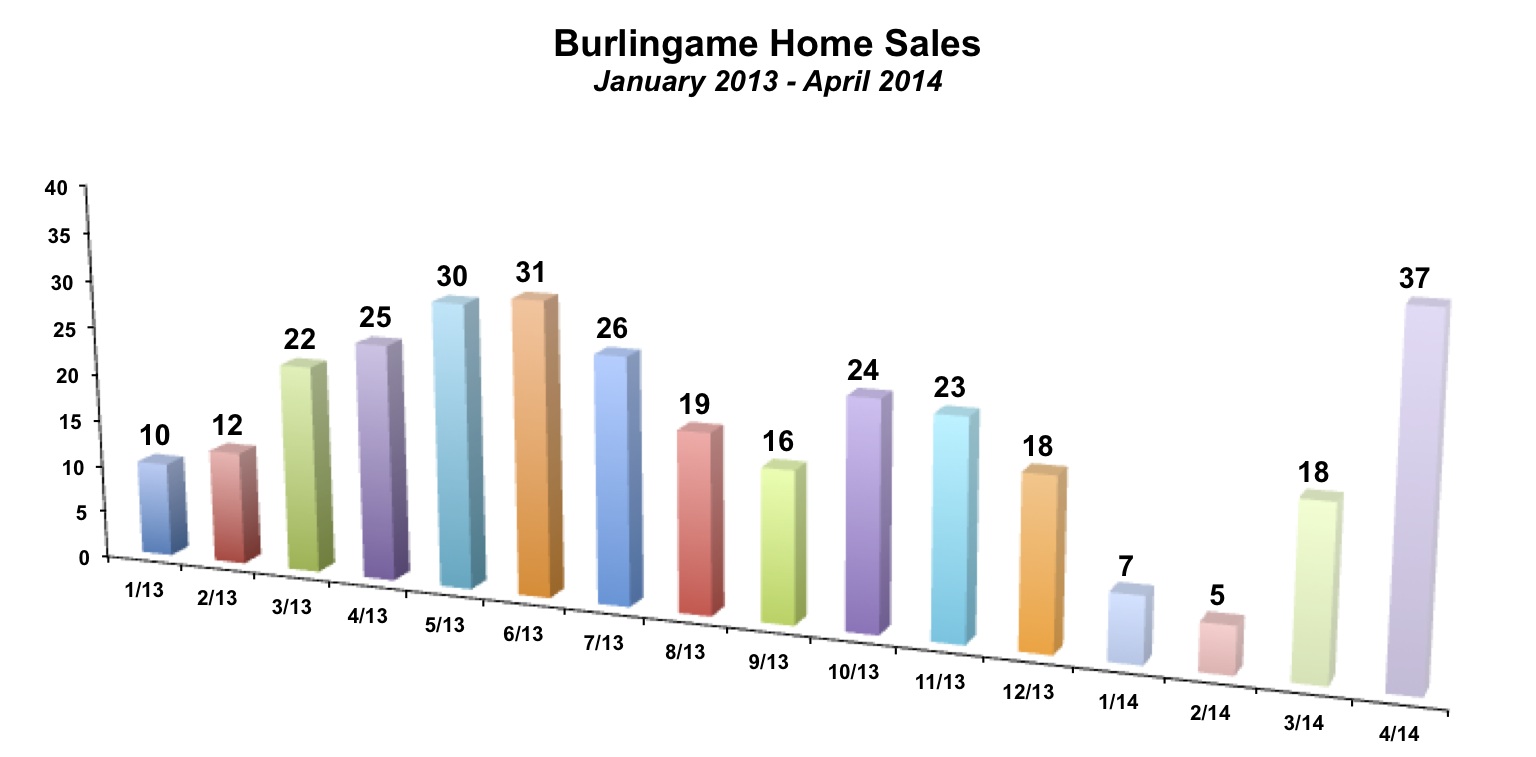
Inventory levels remain at historically low levels in Burlingame. There were just 20 unsold homes for sale in the city at the end of April 2014. This is even with where the market was a year ago and represents the lowest April inventory in at least ten years.
Low inventory is a positive for sellers. Until we see an uptick in inventory, we should expect prices to continue to increase.

Recent Home Sales in Burlingame
Below is a selection of recent Burlingame real estate sales, sorted by area of Burlingame. Looking at these 31 sales gives the same conclusions as the summary data, but it certainly makes the data more "real" to look at individual sales.Homes continue to sell quickly. Only 3 of these homes were on the market for more than 30 days. Most sold in less than 3 weeks.
The sub $1 million single family home sale remains a rare species in Burlingame. There are only two such sales in our sample below. Just as impressively, there were only four sales less than $1.25 million.
Sales of $1,000 per square feet used to be rare. There were about 10 such homes in all of 2013. There were eight alone in April 2014 (and 12 in just the March and April timeframe). A 2 bed, 2.5 bath, 1,210 square foot home on Los Montes in Burlingame Hills sold for $1,608,000, nearly $500,000 above the asking price. On a per square footage basis, the price was $1,329. It is one of the highest per square footage sales in Burlingame ever. The house itself was rather unremarkable. The buyers paid for the 9,500 square foot lot and bay views. As prices surge, we are increasingly see buyers pay more for expandable lots. The cost of construction, even including the permitting process, is significantly less than the price of buying the actual finished square footage at retail.

To see all of the latest Burlingame neighborhood specific market updates, click here.
By The Numbers - Burlingame Real Estate
| Current Month | YTD Total or Average | |||
| April 2013 | April 2014 | Jan-Apr 2013 | Jan-Apr 2014 | |
| Sales | 25 | 37 | 69 | 67 |
| Days on Market | 24 | 15 | 30 | 20 |
| Months of Supply | 0.8 | 0.5 | 0.9 | 1.0 |
| Average Price | $1,459,000 | $1,764,000 | $1,573,725 | $1,748,687 |
| Median Price | $1,475,000 | $1,575,000 | $1,597,000 | $1,556,269 |
| Avg $ per Sq Ft | $719 | $878 | $716 | $866 |
Thinking of buying or selling a home in Burlingame?
If you're interested in learning more about the Burlingame real estate market, considering selling your home in Burlingame, or thinking about moving to Burlingame, please drop me a line and I'd love to connect with you.
This article is copyrighted by Raziel Ungar and may not be reproduced or copied without express written permission.


