San Carlos Real Estate - August 2013
Sellers Market Continues
Prices are at record levels and rising in the San Carlos real estate market. Here are the highlights as of August 2013:- Homes continue to be sold quickly. The average sold home was on the market for just 12 days, the fourth straight month under two weeks.
- Buyers continue to outbid each other. The average sold home went for 8% above the list price, the seventh straight month where the ratio of sales price to list price has been around 110%.
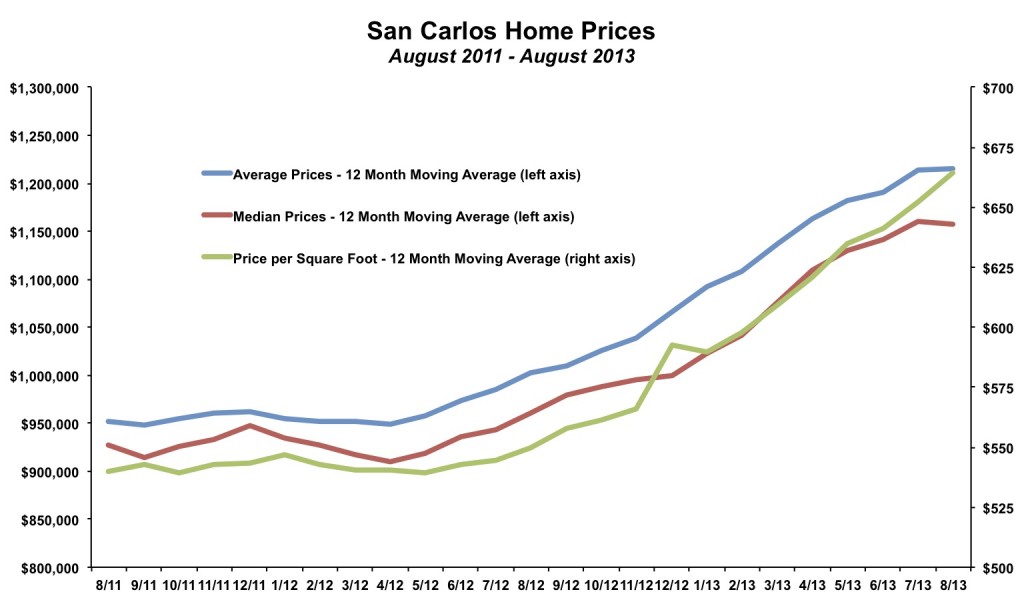
- The average price per square foot was $730 in August 2013. Three out of the last four months have been above $700. Prior to the end of last year, there had never been a reading above $684 in San Carlos.
- Through the first eight months of the year, the average price per square foot in San Carlos has been $682. Prices have increased in-line with neighboring areas. The price per square foot is 9% below Burlingame, about where it has been the past few years. Price may have caught up a bit with the Baywood area. The price per square foot in San Carlos is 8% below Baywood, compared to closer to 15% in the past few years.
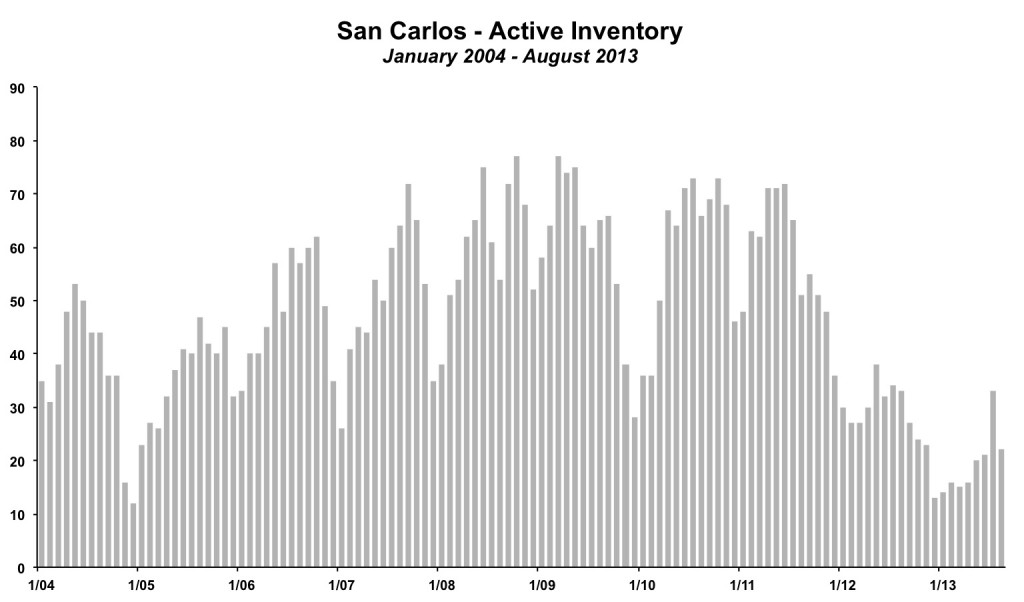
- After increasing unexpectedly in July, inventory levels fell in August to 22 homes, down from 33 unsold homes in August 2012 and 51 unsold homes in August 2011.
Buyers have bid well above asking prices for the past seven months, with the ratio of the average sales price to list price above 108%. The bidding frenzy has led to price increases. Selling values have risen by 1-2% per month each of the past six months.
Recent Steady Sales Activity Continues
The sales pace has quickened in the past few months relative to the beginning of the year when there was a lull in sales (more so than would be suggested by normal seasonal patterns). Not surprisingly, this has coincided with an uptick in new listings. In the past four months (May-August) there have been 130 homes sold. In the same period in 2012, there were 122 sales. 2012 saw the most sales since 2005.Inventory levels, which have been on a two-year decline, jumped sharply in July 2013. Inventory usually increases in the summer, but this was a particularly noticeable increase. Rising inventory is often one of the first signs that sentiment is shifting from a sellers market to a buyers market. However, concerns were allayed in August as inventory fell again back to record lows. The increase in July 2013 now looks to be a blip, just a random timing fluctuation.
By The Numbers - San Carlos Real Estate for 2013
| Current Month | YTD Total or Average | |||
| August 2012 | August 2013 | Jan - Aug 2012 | Jan - Aug 2013 | |
| Sales | 28 | 26 | 220 | 201 |
| Days on Market | 20 | 12 | 30 | 15 |
| Months of Supply | 1.2 | 0.8 | 1.1 | 0.8 |
| Average Price | $1,234,000 | $1,246,000 | $1,040,964 | $1,268,716 |
| Median Price | $1,205,000 | $1,170,000 | $983,159 | $1,226,418 |
| Avg $ per Sq Ft | $584 | $730 | $559 | $682 |
Thinking of buying or selling a home in San Carlos?
If you're interested in learning more about the San Carlos real estate market, considering selling your home in San Carlos, or thinking about moving to San Carlos, please drop me a line and I'd love to connect with you.
This article is copyrighted by Raziel Ungar and may not be reproduced or copied without express written permission.

