April 2014 - Sellers Market Continues
It remains a sellers market in Burlingame. The May 2014 monthly figures for both the average and median selling prices were records.Here are the highlights for May 2014 (comparisons are made to data going back to January 2004):
- The monthly average sales price of $1,810,000 is the first recording above $1.8 million in Burlingame (actually, the first above $1.75 million)
- The monthly median sales price of $1,865,000 is the first recording above $1.85 million in Burlingame.
- The average sold home went for nearly 8% above the asking price. The ratio over the past three months has averaged 108%. This is the highest in at least 10 years. (Translation: Despite 2+ year of price increases, by one measure, the bidding frenzy in the past 3 months has been more intense in at least a decade)
- Eight homes sold above $1,000 per square foot versus ten such homes in all of 2013
- Homes continue to sell quickly. The average home sold in about two weeks.
Prices continue to rise. As an example, four of the six highest recorded monthly median prices have occurred in the first five months of 2014. With prices rising, there are fewer and fewer sub-$1 million single family home sales. There were none in May 2014.
Despite 2+ years of price increases, buyers continue to bid above asking prices. The ratio of sales price to list price in May 2014 was 108%, meaning that buyers paid on average 8% more than the final asking price.
Another Solid Sales Month in May
Although down from last year, the 25 homes sold in May 2014 represents a solid monthly total, especially after April 2014, which saw the second highest monthly total in the past ten years. Still, owing to a slow start to the year, sales activity is down compared to 2013. There have been 92 homes sold in Burlingame in 2014 in the first five months. There were 99 homes sold in the first five months of 2013.
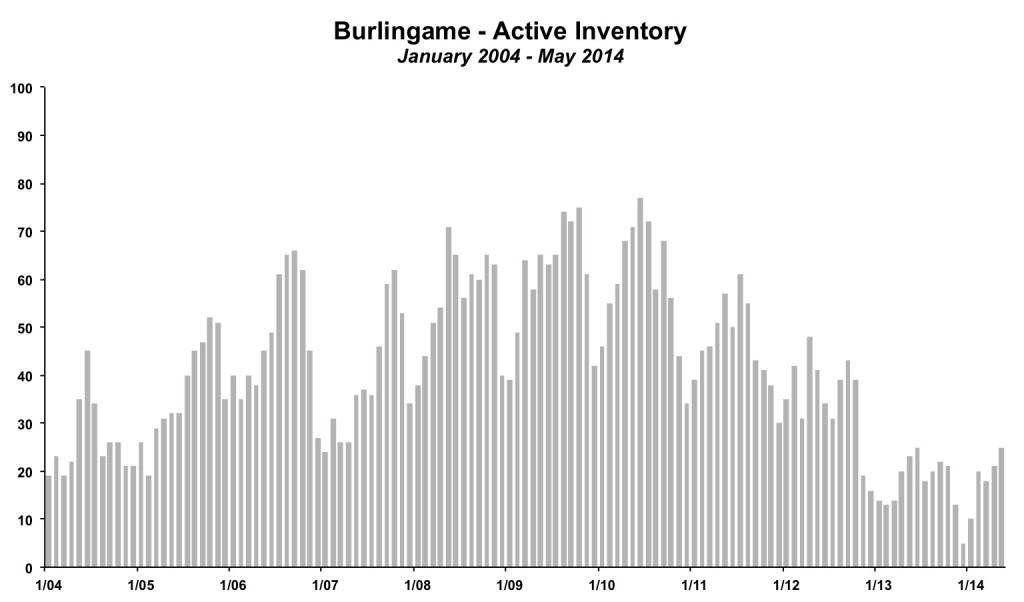
Inventory levels remain at historically low levels in Burlingame, but they seem to have reached a plateau. There were 25 unsold homes for sale in the city at the end of May 2014, which is actually up very slightly from the 23 unsold homes at the end of May 2013.
Low inventory remains a positive for sellers. Normal seasonal trends suggest that inventory levels should increase modestly over the next few months, before falling again towards the end of the year.
Recent Home Sales in Burlingame
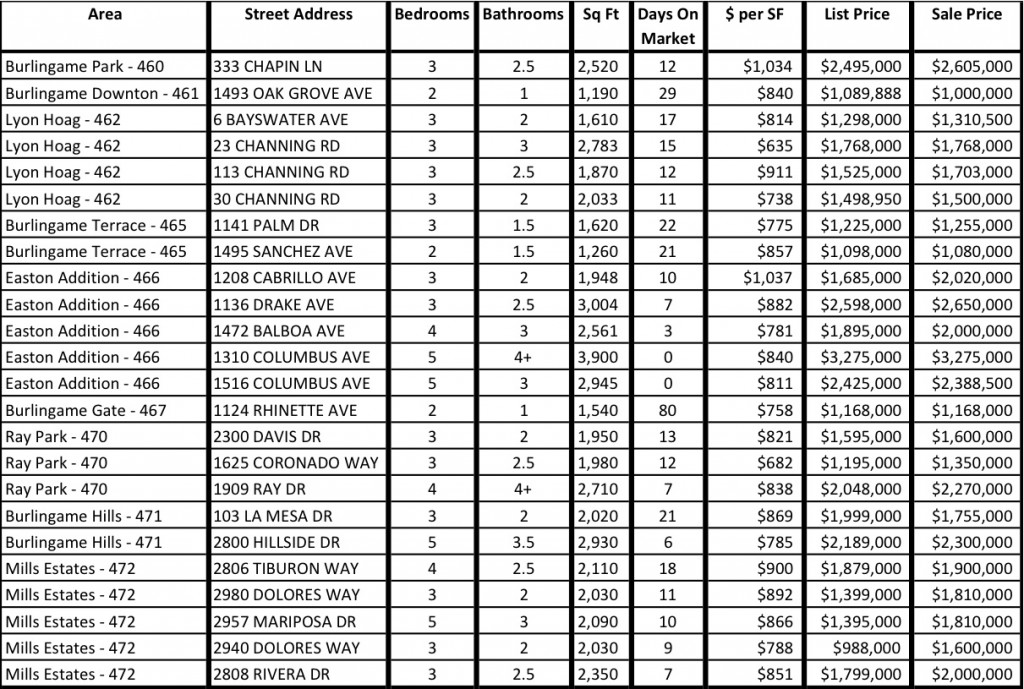
Below is a selection of recent Burlingame real estate sales, sorted by area of Burlingame. Looking at the individual sales backs up a lot of the summary conclusions. Homes are selling quickly (low days on market), prices are high, and buyers are bidding above list prices (only 4 of the 24 sold for less than the list price).This month we wanted to focus more deeply on the difference between the list price and sales price. For buyers, deciding on an offer amount in this type of real estate market is one of the most difficult parts of the buying experience. Not surprisingly, one clue as to whether a home might sell for at or below the asking price is how long it has been on the market. But, the data from the previous month suggests that it takes a couple of weeks for a listing to become "stale". Among all of the 24 sales listed below, the average home sold for about 8% above the list price. For homes on the market longer than 2 weeks, the average sold home went for 2% below the list price. Of the five homes that were on the market for at least 20 days, 3 went below asking, 1 sold at asking and 1 went for $30,000 above asking. It seems that somewhere around the 2+ week mark is where we start to see a difference. For homes sold after 1 week, but faster than 2 weeks, the average sales price to list price ratio was over 110%. Intuitively, this makes sense. After one week (and typically one open house), sellers might want to wait another week if they do not receive any offers well above asking. After all, a single week could be a fluke. Maybe the right buyers were out of town or visiting other homes. After two weeks, the possibility that higher bids may not materialize becomes more real.
Buyers, consider adjusting your offer amounts based on how long the property has been on the market. Listings not sold after 2+ weeks (and more so after 20+ days) are more likely to sell at or below the asking price than newer listings.
To see all of the latest Burlingame neighborhood specific market updates, click here.
By The Numbers - Burlingame Real Estate
| Current Month | YTD Total or Average | |||
| May 2013 | May 2014 | Jan-May 2013 | Jan-May 2014 | |
| Sales | 30 | 25 | 99 | 92 |
| Days on Market | 32 | 14 | 30 | 17 |
| Months of Supply | 0.8 | 1.0 | 0.9 | 1.0 |
| Average Price | $1,811,000 | $1,865,000 | $1,645,626 | $1,780,293 |
| Median Price | $1,702,000 | $1,810,000 | $1,628,818 | $1,625,217 |
| Avg $ per Sq Ft | $781 | $837 | $736 | $858 |
Thinking of buying or selling a home in Burlingame?
If you're interested in learning more about the Burlingame real estate market, considering selling your home in Burlingame, or thinking about moving to Burlingame, please drop me a line and I'd love to connect with you.
This article is copyrighted by Raziel Ungar and may not be reproduced or copied without express written permission.
=


