Hillsborough Real Estate - February 2014

Buyers Bid Above Asking in Hillsborough
Like the rest of San Mateo County prices are at record levels in the Hillsborough real estate market. Highlights as of February 2014:- The ratio of the sales price to list prices of homes sold in February 2014 was 102.7% in Hillsborough. That is the highest monthly value for that statistic in the city in at least 10 years.
- Inventory remains low, with just 38 unsold homes at the end of the month, as compared to 50 unsold homes at the same point in the year prior.
The chart below shows the 12 month moving average for median prices, average prices and average price per square foot. Taking a 12 month average helps to smooth out random fluctuations. However, even when doing this, there can still be anomalies. At first glance, it appears prices tumbled in February 2014. What actually happened was that in February 2013, there were a number of high-end homes that sold (high-end even by Hillsborough standards). The average sales price in February 2013 was over $6 million. In February 2014, that month was removed from the 12 month moving average, and replaced by the more modest $2.5 million average sales price in February 2014. The result was a notable decline in the 12 month moving average.

Interestingly, despite the decline in the graph, it seems likely that prices actually continued their ascent in February 2014. This is because the ratio of sales price to list price for sold homes in the month was 102.7%. This was the highest monthly value in at least ten years in the city. Hillsborough is a bit idiosyncratic and in a neutral market where prices are neither rising nor falling, the ratio is usually in the range of 96% to 97% (in most cities in the mid-Peninsula, neutral is around 100%). Assuming that recent sellers set their list prices in the same manner that sellers have typically done in Hillsborough, the fact that they received nearly 3% above their asking price, instead of 3% below the asking price is a sign that prices are rising.

Home Sales Running Ahead of Prior Year Pace
There have been 22 homes sold in Hillsborough in the first two months of the year. This is the most number of homes sold to start the year since 2005, when 25 homes sold in the first two months.
The inventory of unsold homes rose slightly from 33 listings in January 2014 to 38 listings in February 2014 in Hillsborough. However, while inventory did increase numerically, adjusting for the normal seasonal pattern, inventory levels probably fell in February.
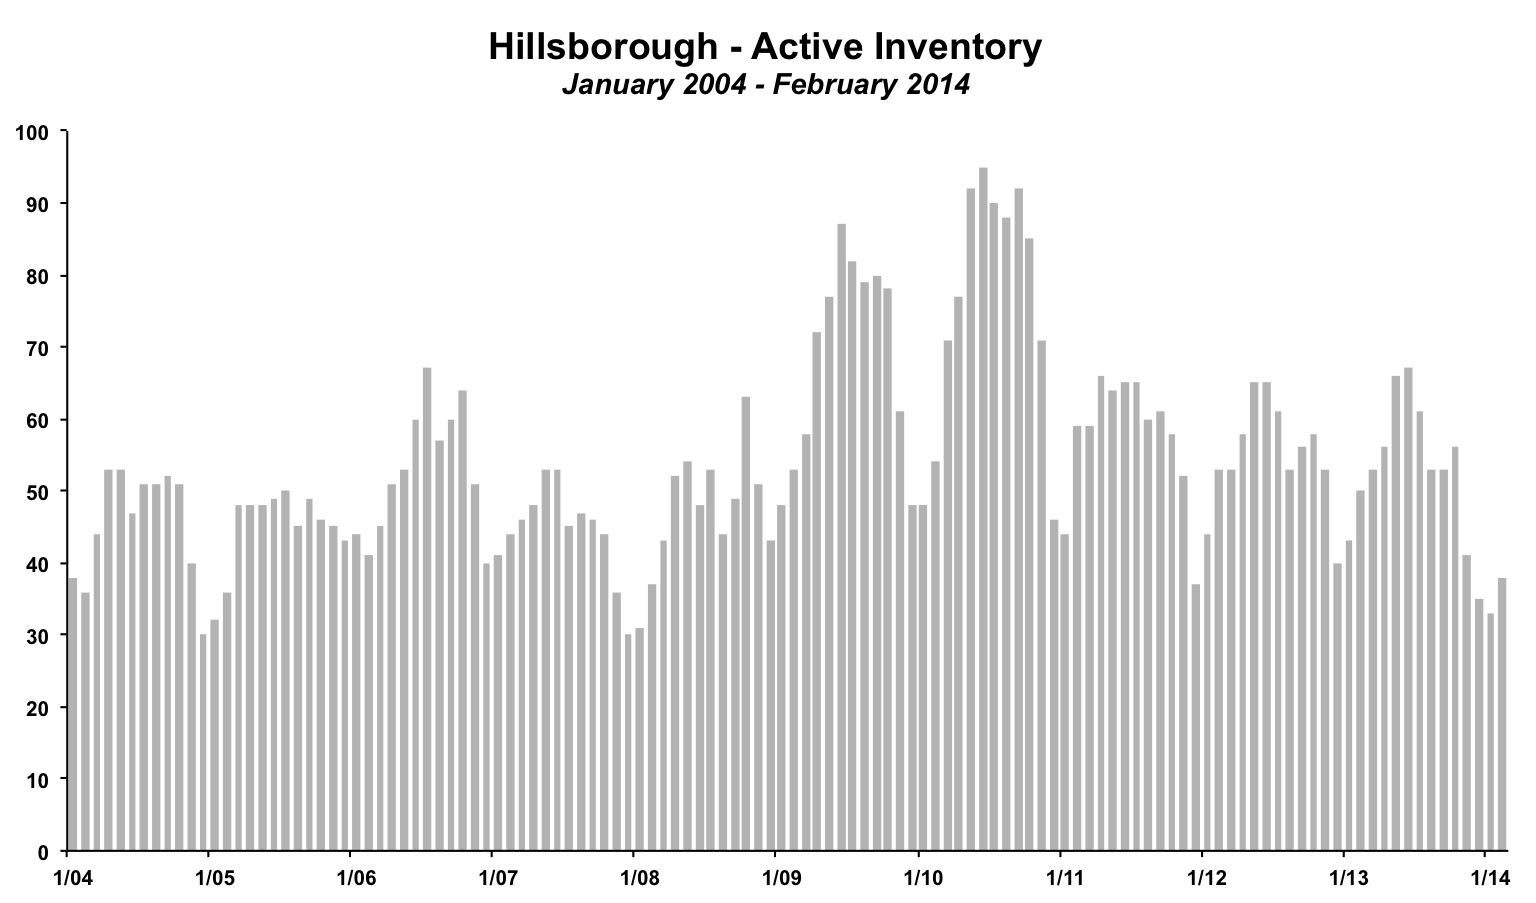
The graph below shows ending month inventory levels going back to January 2004 in the Hillsborough real estate market. In most years, and in particular the past five or so, you can see two low values and then the rest of the months are higher. Those two low months are December and January. Real estate activity slows in those months. Sellers either do not list their home or sometimes remove their home from the market during the holidays. Then typically in February, inventory starts to climb as sellers put their homes on the market, but buyers become more active in the spring and summer. The result is that February usually sees a jump in inventory. An increase of five homes is actually below average and suggests a tightening of supply, when adjusted for seasonality.
By The Numbers - Hillsborough Real Estate
| Current Month | YTD Total or Average | |||
| February 2013 | February 2014 | Jan-Feb 2013 | Jan-Feb 2014 | |
| Sales | 8 | 8 | 14 | 22 |
| Days on Market | 92 | 48 | 74 | 77 |
| Months of Supply | 6.3 | 4.8 | 6.7 | 3.3 |
| Average Price | $6,596,000 | $2,574,000 | $4,656,286 | $3,080,545 |
| Median Price | $5,300,000 | $2,501,000 | $3,971,429 | $3,009,455 |
| Avg $ per Sq Ft | $863 | $796 | $815 | $836 |
Thinking of buying or selling a home in Hillsborough?
If you're interested in learning more about the Hillsborough real estate market, considering selling your home in Hillsborough, or thinking about moving to Hillsborough, please drop me a line and I'd love to connect with you.
This article is copyrighted by Raziel Ungar and may not be reproduced or copied without express written permission.


