Hillsborough
Carolands
The Carolands is Hillsborough's "every neighborhood"
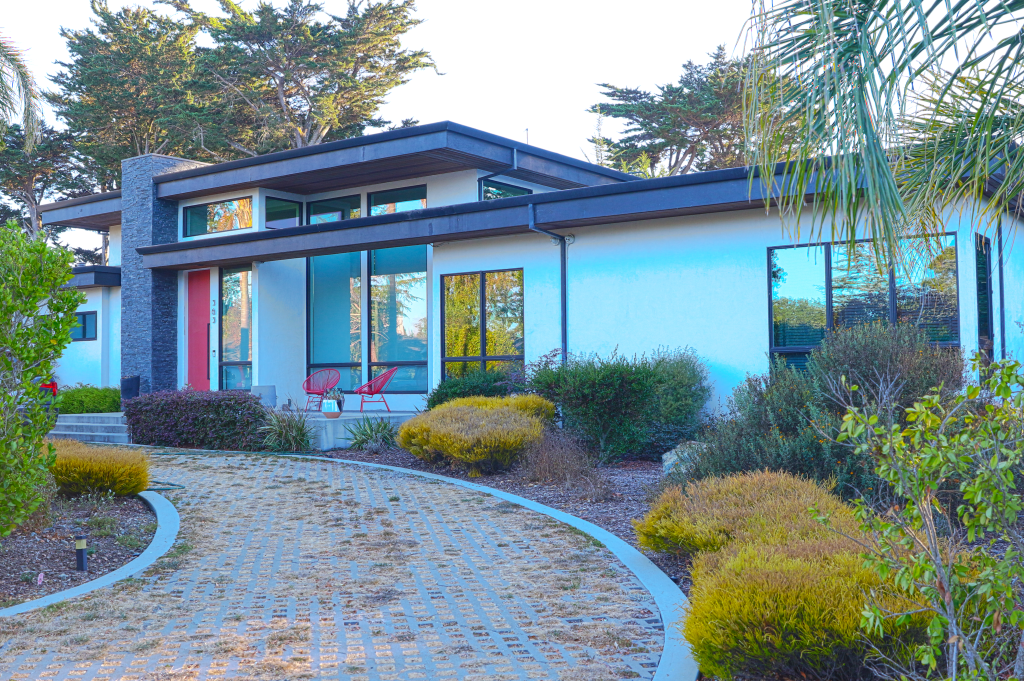
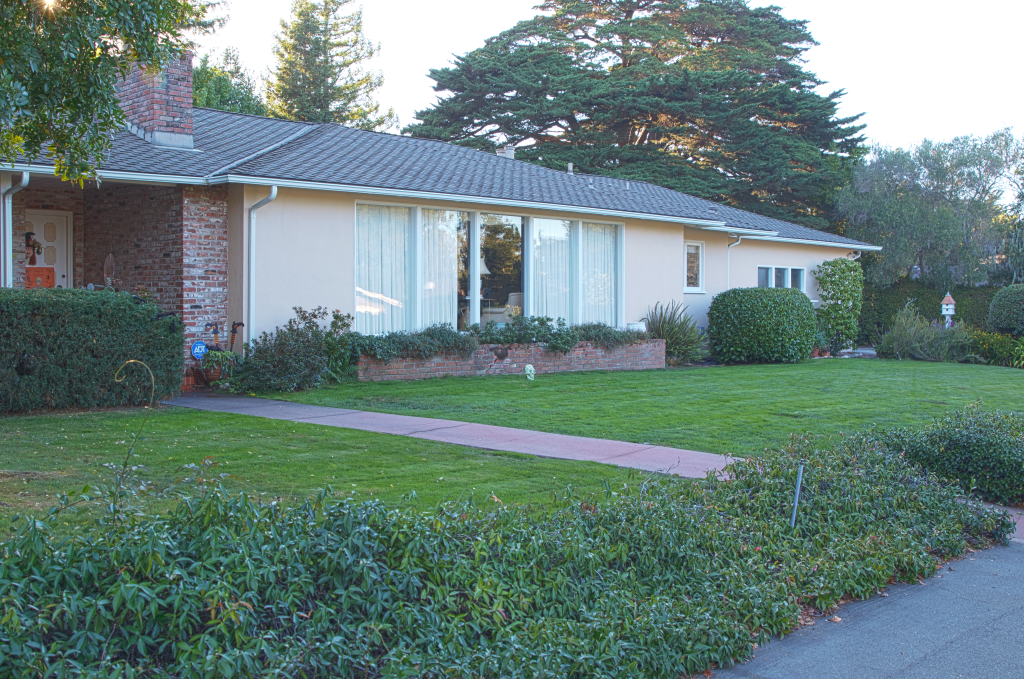
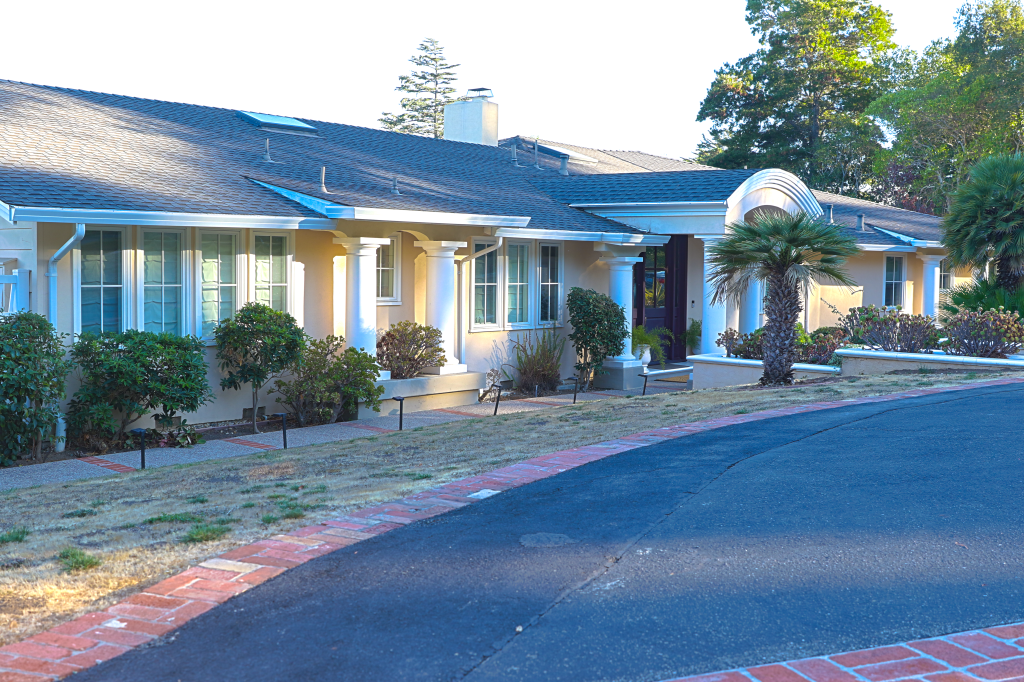
Carolands real estate ranges in price from the mid-$3 million all the way up to eight figures. The community’s housing inventory leans toward sprawling, three-, four- and five-bedroom ranch-style homes built in the 1950s and 60s, with spacious half-acre-and-up lots. Many have San Francisco Bay views. Dotted in among the original mid-century homes are newer, often larger properties, and a handful of older, traditional homes whose origins pre-date the subdivision of the original Carolands estate.
Carolands activity rebounded last year as sales rose by 62%. 21 homes sold in the Upper Hillsborough neighborhood, making it the most popular neighborhood in 2024. Average home values fell to $4.95 million but consider this: 75% of Carolands’ 2024 sales fell between $4 and $6 million, with the highest neighborhood sale coming in at $7.38 million. This contrasts with 2023 when a pair of eight-figure sales (out of 13 total sales) pushed the neighborhood average to $5.85 million. Also, consider that Carolands homes sold 10% more per square foot ($1,459) in 2024 than in 2023 and the average DOM fell by 23%, from 30 in 2023 to 23 in 2024.
To view a detailed google map of the Carolands neighborhood, click here. The MLS area is 446.
Favorable
- A wide range in real estate prices
- Has newer and larger properties as well as older and traditional homes
- Spread out, ranch style homes with spacious, half-acre-and-up lots
- Many homes have San Francisco Bay views
Adverse
- Inventory is typically on the lower side
-
551
Homes
-
$4.79M
Median Sale Price
-
$5.03M
Average Sale Price
Pricing data based on single-family homes
Carolands
Stats & Trends
Home Data
Per tax records
2 Bedrooms
4
homes
3 Bedrooms
190
homes
4 Bedrooms
232
homes
5+ Bedrooms
125
homes
2022 Price Data
Number of Sales
16
sales
Percent List Price Received
99.8%
Median Sales Price
$4.79M
Average Sales Price
$5.03M
Lowest Sales Price
$3.6M
Highest Sales Price
$7M
Carolands on the Map
What you need to know about the Hillsborough real estate market
Examine mid year market trends, relevant sales statistics and learn what I'm seeing first-hand in your neighborhood.

Schools & History
Schools
Carolands is a home to West Hillsborough Elementary School, one of the Hillsborough’s three excellent public elementary schools. The school is located on Barbara Way between Hayne Road and Denise Dr. Portion of the neighborhood attends North Hillsborough Elementary School, located in the Country Manor neighborhood on Eucalyptus Avenue.
There is one public middle school in Hillsborough, Crocker Middle School, which is located in the Country Club Manor neighborhood on Ralston Avenue. It is about 5 minute drive from Carolands.
Hillsborough does not have its own public high school. Most of the neighborhood goes to Burlingame High School, located in Burlingame on Margini Way. To search a high school by a specific address using a School Locator, click here.
History
The 100-room mansion for which Carolands is named was built for railroad heiress Hariett Pullman Carolan in 1914. Twice considered for service as a Western White House (in 1939 and 1960), the home still stands. Its original 554-acre plot of land, however, was subdivided in the late 1940s, creating what is now a long-established residential community. In 1998, after decades of decline, the mansion found new owners and underwent a $20 million restoration.

Contact Raziel to find the right property for you.
With a team of experts guiding you every step of the way, our extensive knowledge and experience will ensure you have the best home buying experience possible.


