Hillsborough Real Estate - October 2014


Low Inventory Favors Sellers
Inventor levels are at record lows in the Hillsborough real estate market. Buyer demand remains strong and with fewer homes from which to choose prices are rising. Highlights as of October 2014:- Hillsborough is on pace to have the most sales since 2005, and the fewest new listings in over a decade.
- While it varies month-to-month, average prices per square foot are regularly above $850 (they were $851 in October 2014 and $995 in September 2014).
- Inventory remains at historically low levels. There were 34 unsold homes at the end of the October, which is the lowest October inventory level in at least ten years.
- There has been only 38 expired/cancelled listings through October (not all of which represent a failure to sell, as in many cases sellers just change their minds or timing), as compared to 52 through October 2013.
The average price per square foot measure avoids most of these issues and may be a truer measure of price trends. This suggests that prices are up about 7% year-over-year. Price appreciation appears to have slowed since late 2013/early 2014 when it was well above 10% year-over-year.

The ratio of average sales price to list price was 98.7% in October 2014. For the year, amongst homes that have sold, sellers are receiving on average just about their list price (99.8% to be exact). Hillsborough is a bit idiosyncratic and in a neutral market where prices are neither rising nor falling, the ratio is usually in the range of 96% to 97% (in most cities in the mid-Peninsula, neutral is around 100%). In fact, in the past ten years, the ratio in Hillsborough has never averaged above 100%. The previous high was in 2005 at 98.9%. When this ratio is above the normal baseline, as it has been for most of 2014 it suggests that buyers outnumber sellers and may foreshadow continued price increases.

Sales Activity Up Slightly in 2014
There have been 129 homes sold through October 2014 in Hillsborough. Last year at this time, 121 homes had been sold. It's hard to predict exactly how many homes will sell in the last two months of the year, but 2014 could reasonably end up with 150 sales. That would be the most since 152 homes sold in 2005. Last year, 145 homes sold.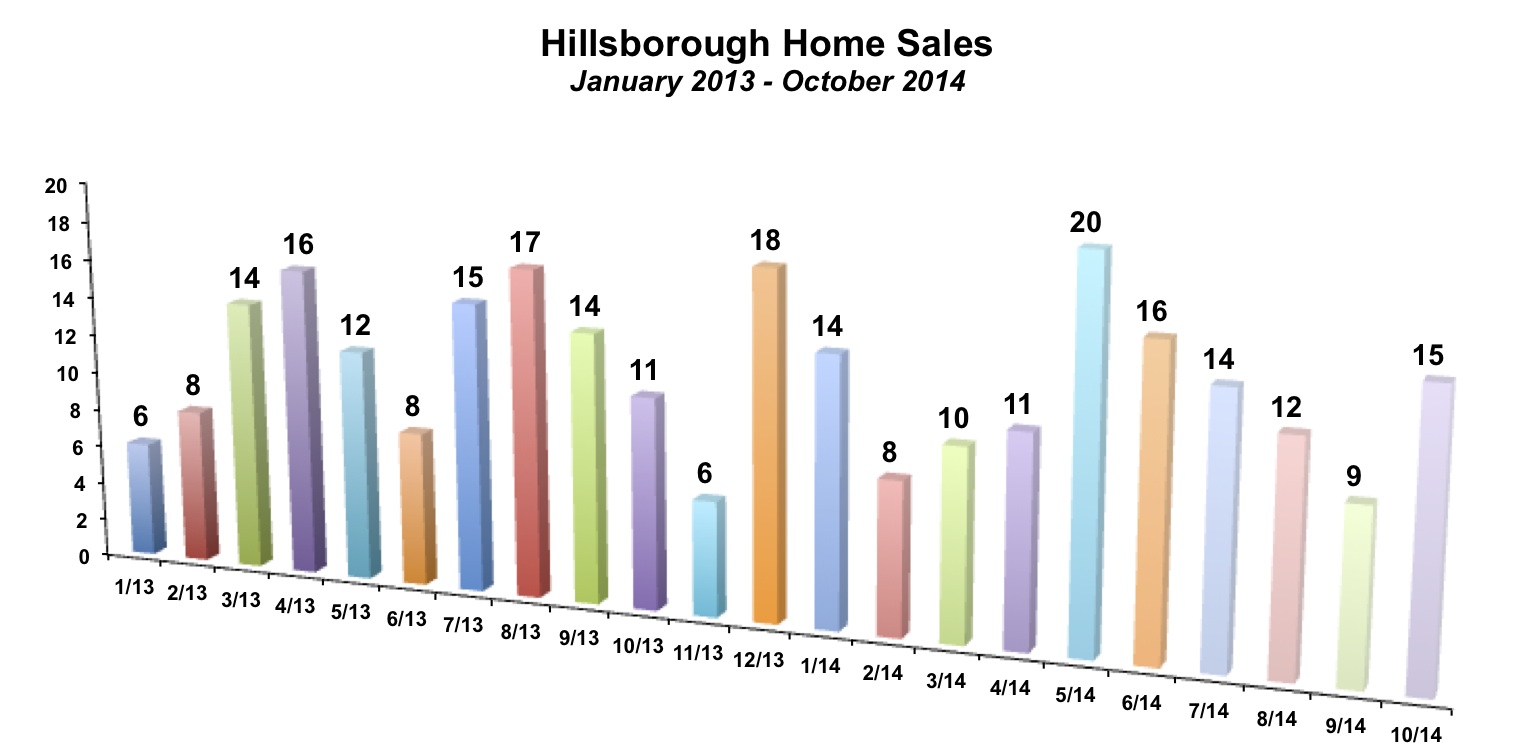
Sales activity running 8 homes ahead of last year might not seem like a big deal, but it is actually quite impressive when you factor in the huge drop in the number of new listed homes. There have been just 161 newly listed homes through October, down from 191 homes listed in the first ten months of 2013. With many fewer homes coming onto the market, one would have expected sales to decline.
Another way to look at it is to compare the ratio of sales to new listings. This is a very crude way to measure seller success. Barring a very odd end to the year, 2014 should end up with a ratio of sales to new listings of 80%. (This doesn't mean that 20% of sellers were unsuccessful. Some of them may have changed their minds and pulled their home off the market. Some may have listed later in the year and will find a buyer next year, etc...). Still, it is a good measure of buyer demand. Last year, the ratio was 70%. That was actually the highest in at least 10 years. The average has been 60%. It was as low as 42% in 2009 when buyers were harder to find.
Not surprisingly, high levels of sales and fewer new listings is pushing down inventory levels. There were 34 unsold homes at the end of October. Inventory levels are seasonal and this is the lowest October in at least 10 years. If normal patterns persist, we are very likely to see inventory fall below 30 homes at the end of the year for the first time in over a decade.

By The Numbers - Hillsborough Real Estate
| Current Month | YTD Total or Average | |||
| October 2013 | October 2014 | Jan-Oct 2013 | Jan-Oct 2014 | |
| Sales | 11 | 15 | 121 | 129 |
| Days on Market | 22 | 60 | 60 | 62 |
| Months of Supply | 5.0 | 2.3 | 4.6 | 3.0 |
| Average Price | $3,423,000 | $3,319,000 | $3,564,537 | $3,702,946 |
| Median Price | $3,600,000 | $2,800,000 | $3,211,719 | $3,275,147 |
| Avg $ per Sq Ft | $873 | $787 | $816 | $878 |
Thinking of buying or selling a home in Hillsborough?
If you're interested in learning more about the Hillsborough real estate market, considering selling your home in Hillsborough, or thinking about moving to Hillsborough, please drop me a line and I'd love to connect with you.


