February 2023 Market Update: ➡️ or ⬇️?

I'm excited to share with you some news on our local real estate market and what's been happening. We will explore a number of charts and fascinating numbers from the market. For those of you who love data, I've included some interesting slides on the current trends in the marketplace, as well as some insightful information on population and migration movements.
In short, though, I'll share with you what's on everyone's mind - home values.
From a home value perspective, average and median prices countywide are down an average of 14% and 18% since the peak in March 2022 (we calculated a three-month rolling average of January to March 2022, and then November 2022 to January 2023; please see the chart below).
However, compared to Q4 2020, we are roughly about even on median price (up 2.88%) and average price (up 11.51%). Comparing Q1 2021 to our current last three month rolling average, average prices are up 0.89%, and median prices are down 6.29%.
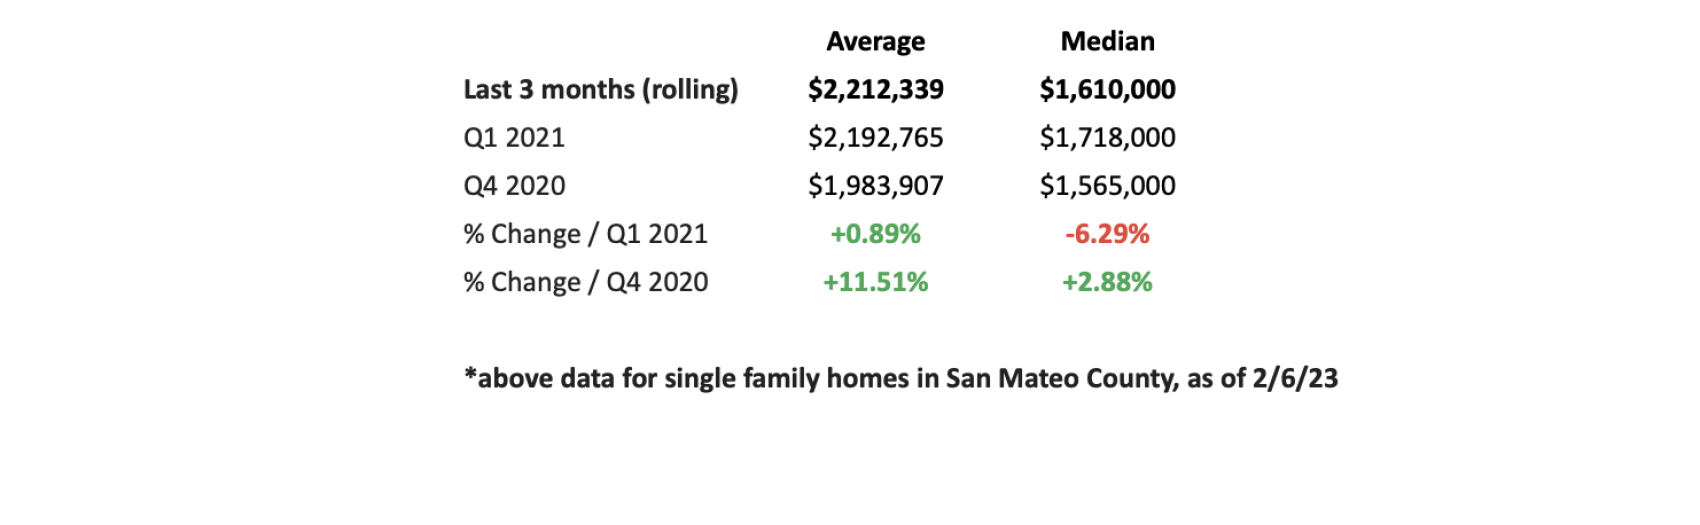
Above data for single family homes in San Mateo County as of 2/6/23
Last year, prices went up a bunch and peaked in March 2022, and then rolled back to where they were about two years ago.
Why has all this happened? The main reason has been the huge rise in interest rates which has slowed down the market in a significant way -- borrowing costs are higher for buyers than they've been in the past, and there's a lot fewer sales, primarily because fewer homeowners have placed their homes on the market. In fact, January 2023 had the lowest sales volume of any month in 18+ years. That has kept prices pretty stable since there's so little supply on the market. I am working with buyers who are ready to buy, if only the right place came on the market. So, for sellers with a nice home on a nice street, priced fairly, they'd do well now.
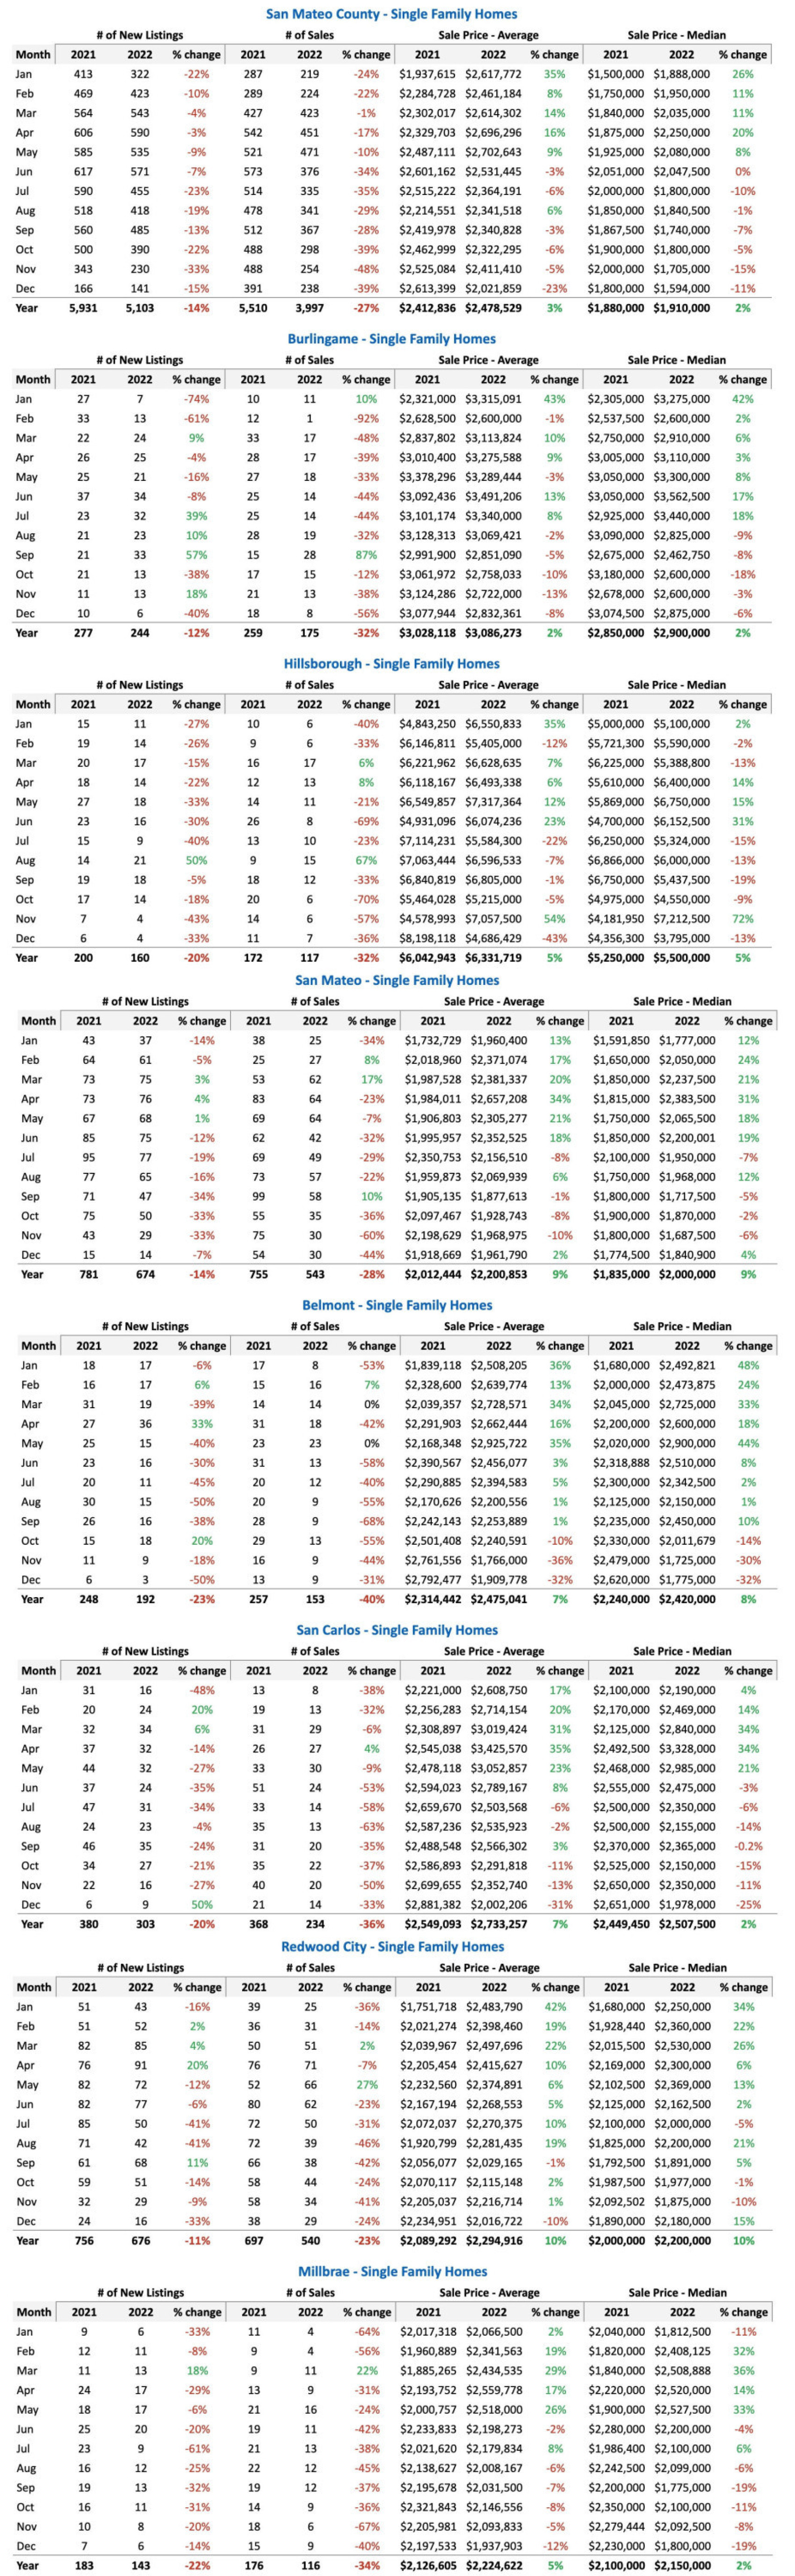
Below is what I consider the most relevant information to get a sense for how a market is doing, that can fit in one screenshot. The metrics below include number of new listings, number of sales, and average and median sales prices. Other metrics like days on market, and sale to list price ratio, are not included here, are also relevant statistics I like to look at closely.
Let's take a look at sales volume over a period of time, which I find very interesting. Remember earlier in the post I mentioned January 2023 was the lowest sales volume in 18+ years.


Below are a couple slides showing how many homes were for sale at the beginning of each month, as well as months supply of inventory.


Now let's take a look at what's actually happening in the market with new transactions...in the first chart below, a lot of it is seasonally related, though you can see the huge drop in December/January. Again, in the second graph, no surprise, many sellers who were hoping for higher sales prices that weren't going to happen chose to pull their homes from the market.


Here we can see the drop in the number of home sales closing over the asking price, over the last few years. With prices decreasing significantly from Q1 2022, it makes sense that fewer homes are selling over asking - really on the very best pieces of real estate.


Below, we can see the notable flip in homes selling way over asking last Spring, and then now selling in the low to mid 90% range. In the second chart, we average days on market are much higher, however, really good homes that are priced well will still sell in a week or two (saw that happen on one this week in Belmont that had over fifty disclosure packages pulled on it!).


Shifting gears, let's take a look at unemployment rates and inflation. Over the last three years, we've seen quite a bit of fluctuation, with a mild recent increase in the Bay Area, notably from the layoffs at the large tech companies. I've yet to see any effect personally with my clients, though regardless, those who hold RSUs that would have been used for down payments have had their values drop significantly as stock prices in their companies have dropped too.


Below, let's take a look at some interesting hyperlocal population trends and statistics, specifically for San Mateo County and the Bay Area.


This article is copyrighted by Raziel Ungar and may not be reproduced or copied without express written permission.


